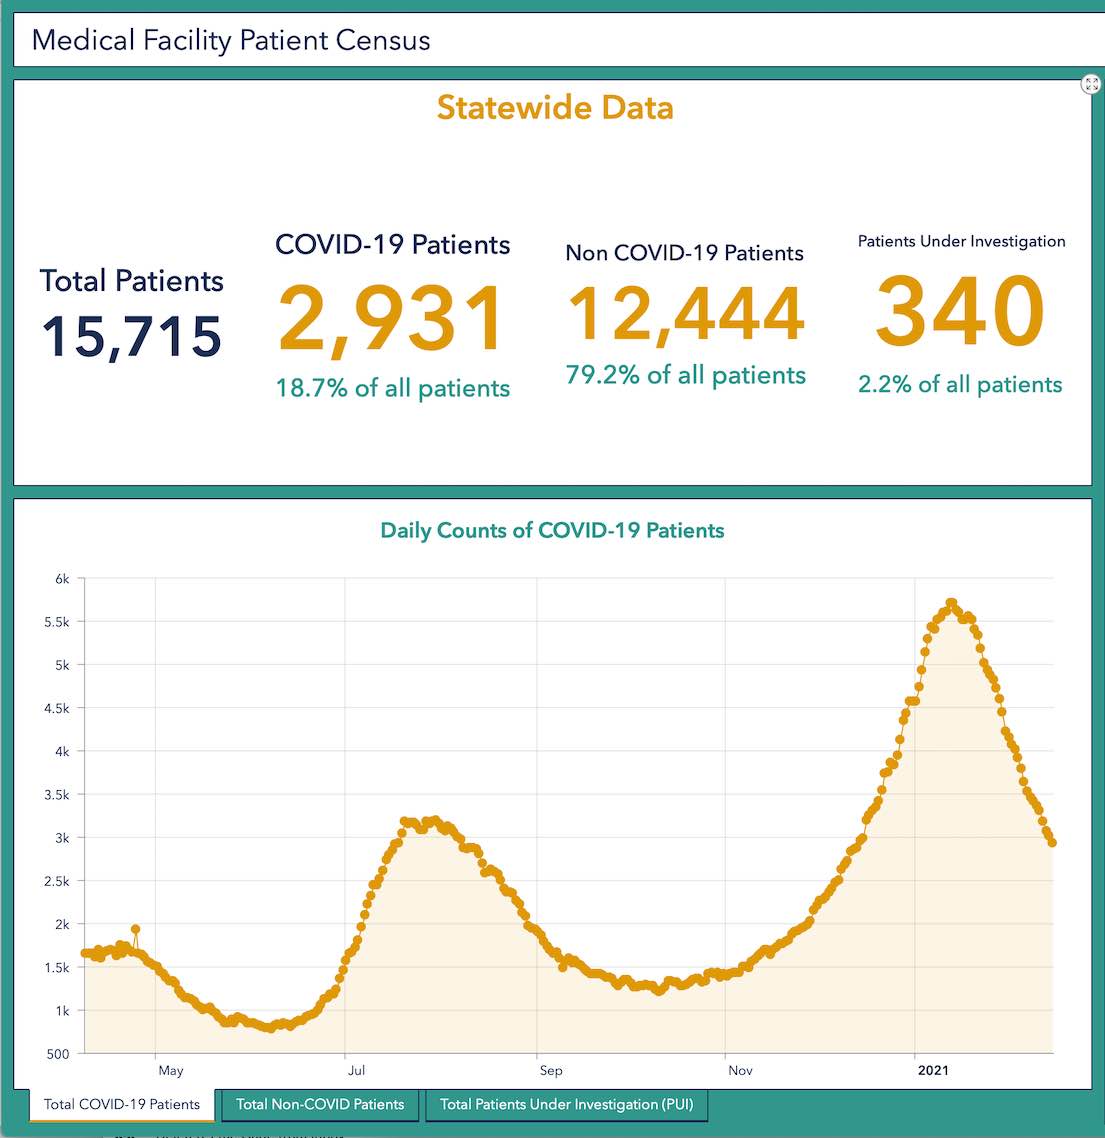
For the first time in 9 weeks, Georgia’s medical facilities on Sunday reported fewer than 3,000 Covid patients being treated in hospitals.
The last time that happened was Dec. 13, when there were then 2,866 seriously ill patients being treated in hospitals across the state. At that time, the Covid patients represented 18.1% of all hospital patients in the state.
Nine weeks later, after a mid-January Covid infection surge that increased the number of very sick Covid patients in hospital beds to a peak of 5,717, the number of Covid patients in hospitals has fallen to 2,931, a drop of 48.7%, according to data provided by the Georgia Department of Public Health (See main graph above). The Feb. 14 hospitalization number represents 18.7% of all hospitalized patients.
With the typical weekend reporting lag, both state and Fayette numbers dropped Sunday, though inevitably the catch-up as reporting officials go back to work after a weekend off somewhat distorts the following Monday and Tuesday counts.
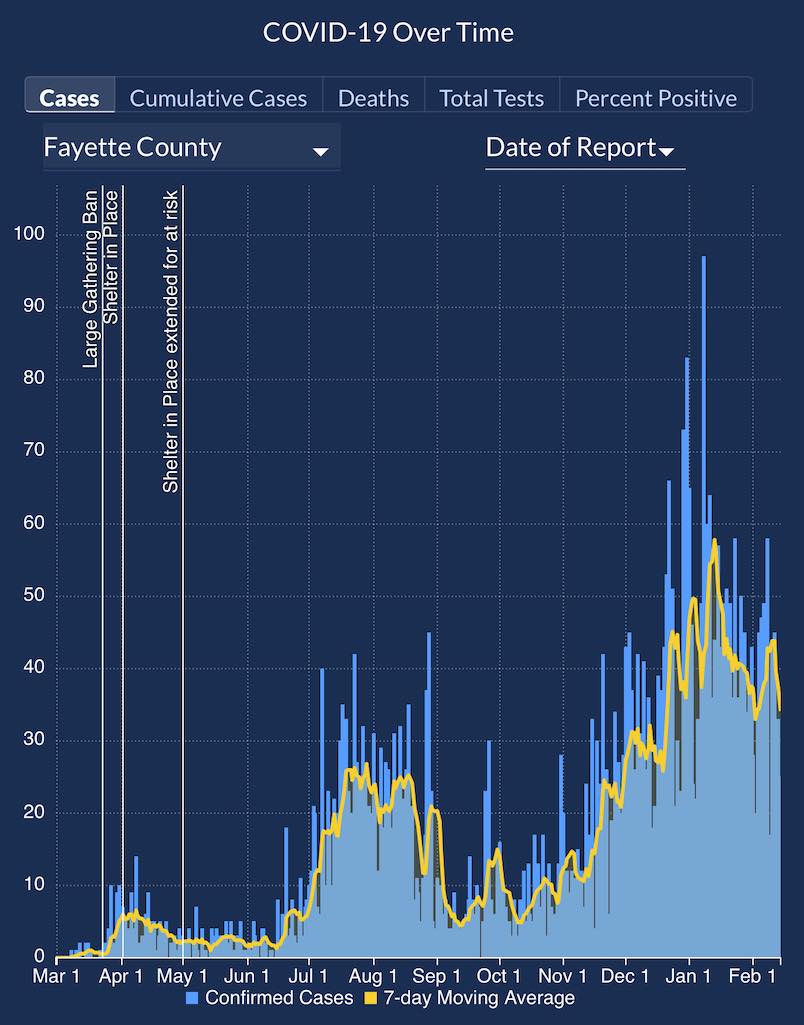
With that in mind, the Feb. 14 Covid report showed that Fayette new cases dropped to 25 for a pandemic total of 5,670, and the death toll held steady at 115. The exception was the report of what DPH calls “probable” Covid-related fatalities. The Fayette number increased by 1 to 12 “probables.” (The DPH list of Fayette residents who succumbed to Covid-19 is here.)
Fayette’s 2-week new case rate dropped to 9.3% with the 2-week new case number at 509.
Sunday reports of Covid fatalities also lagged across the state with only 3 new deaths being reported to bring the state toll to 13,964. The number of “probable” Covid deaths increased by 18 to 1,907.
The Sunday lag also affected statewide reports of hospitalizations and ICU admissions, 39 and 4, respectively.
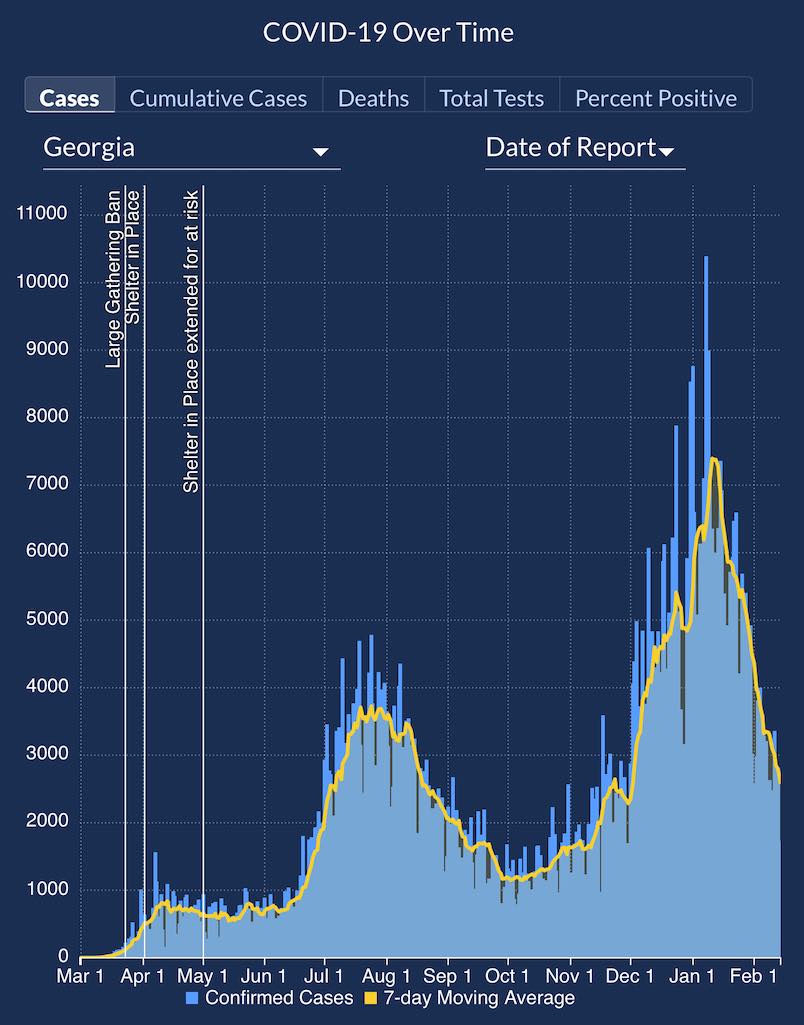
The Georgia total new cases increased by 1,709, the first time in weeks that number has been that low. the state’s new case total now is 790,779.
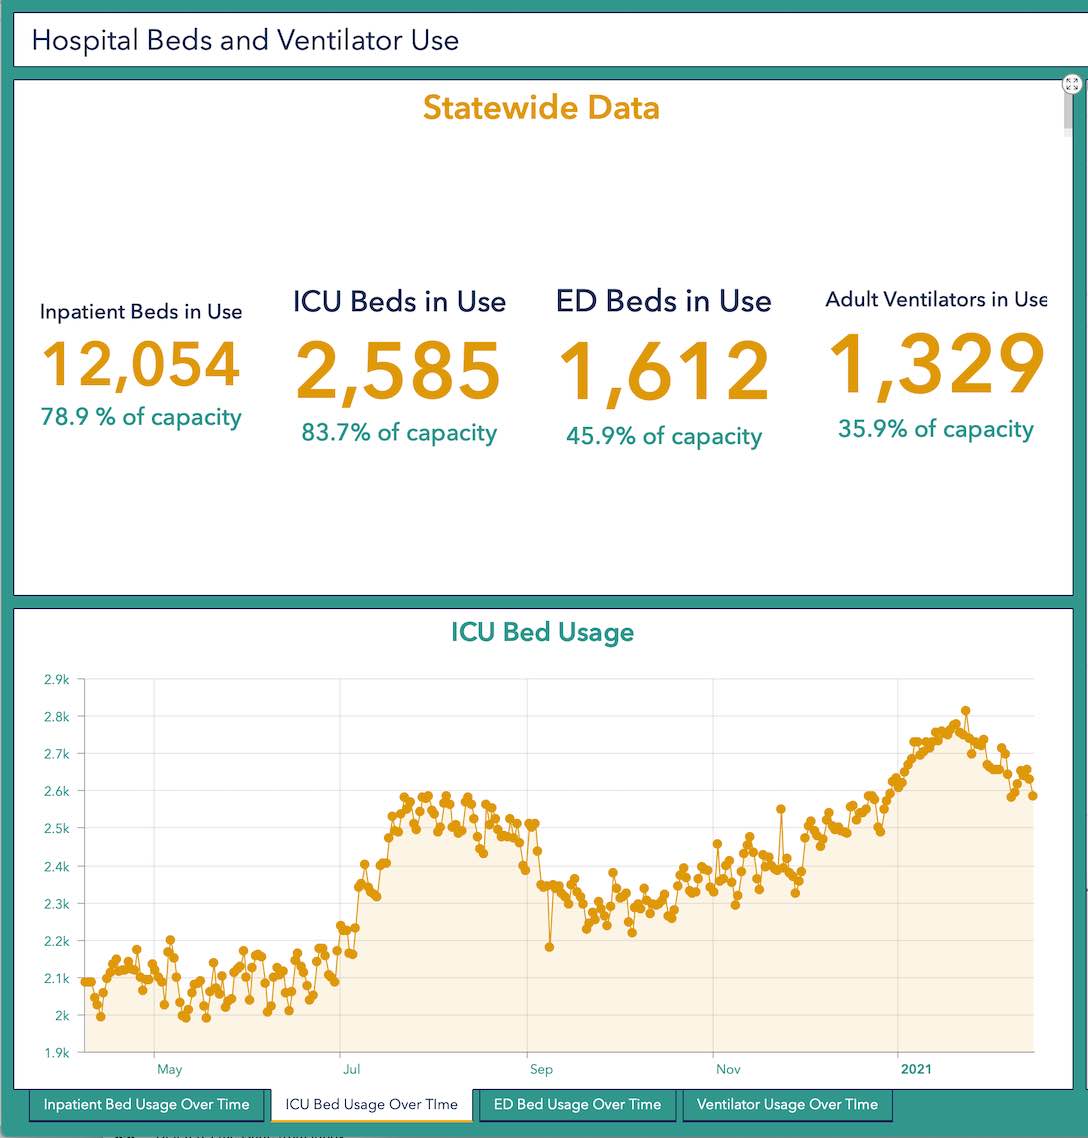
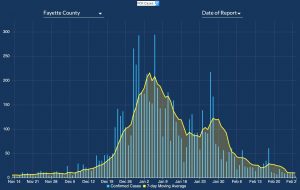
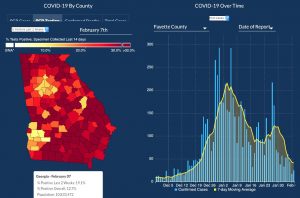
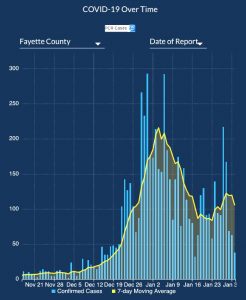
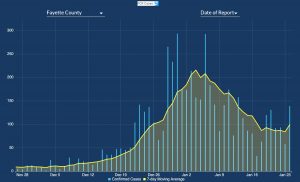
Below are DPH graphs showing the 7-day moving average of new cases for both Fayette County and the state of Georgia, as well as a graph showing ICU bed usage and availability.





Leave a Comment
You must be logged in to post a comment.