


Here’s the Covid-19 pandemic report from the Georgia Department of Public Health as of 2:50 p.m., Aug. 26.
SUMMARY: After a brief dip, Covid-19 cases numbers and percentage of confirmed illnesses are on the rise in Fayette.
Fayette reported 19 new cases today, while the rates of positive confirmed tests have risen from 5.2% two days ago to 5.7% today. The two-week total is 254 new cases and 1,453 cases overall.
Meanwhile, our neighbor to the west, Coweta County, has been experiencing a sustained crush of new cases and rising positive rates just as public schools prepare to go back into session.
Its confirmed cases jumped 66 cases today to a total of 2,107 with a sizzling rate of 12.4% of positive tests over the past two weeks and 484 new cases in that same 2-week span.
The daily reports show that Coweta went from 1,503 cases on Aug. 9 to 2,014 cases by Aug. 23, a jump of over 500 new cases in 2 weeks.
By comparison, Fayette numbers went from 1,120 cases on Aug. 9 to 1,412 cases on Aug. 23, a jump of 292 cases in that same 2-week period.
Overall statewide numbers are slowing their increases, and Covid-19 designated hospital beds are no longer going up in occupancy rates. According to the Georgia Emergency Management Agency tally as of Aug. 25, 2,260 Covid-19 patients were occupying hospital beds, 90 fewer patients than the day before.
By one statistical measurement, Fayette falls significantly behind Coweta, even though Coweta has a Peachtree City’s worth of population more than Fayette. That is in fatalities attributed to Covid-19. Fayette has recorded 36 pandemic deaths while Coweta — with 34,457 more people — has seen 26 deaths, 10 fewer than Fayette.
THE NUMBERS: Fayette cases — 1,453 (19 new cases more than the previous day’s reported total of 1,434). The single-day record for Fayette cases reported is 40 on July 23. The previous record for a single-day increase in Fayette was 36 on July 7. DPH has resumed reporting confirmed new cases covering the period of the past 2 weeks. In the past two weeks, Fayette has reported 254 confirmed new cases.
Fayette deaths — 36 deaths, unchanged from the previous report.
Fayette hospitalizations — 76, 2 more than the previous report.
Fayette death rate per 100K — 30.6 persons per 100,000 persons.
Fayette new cases since May 1 — 1,276; average per day increase — 10.8. New cases since July 1 — 1,112. Fayette’s average since July 1 — 19.5 new cases a day.
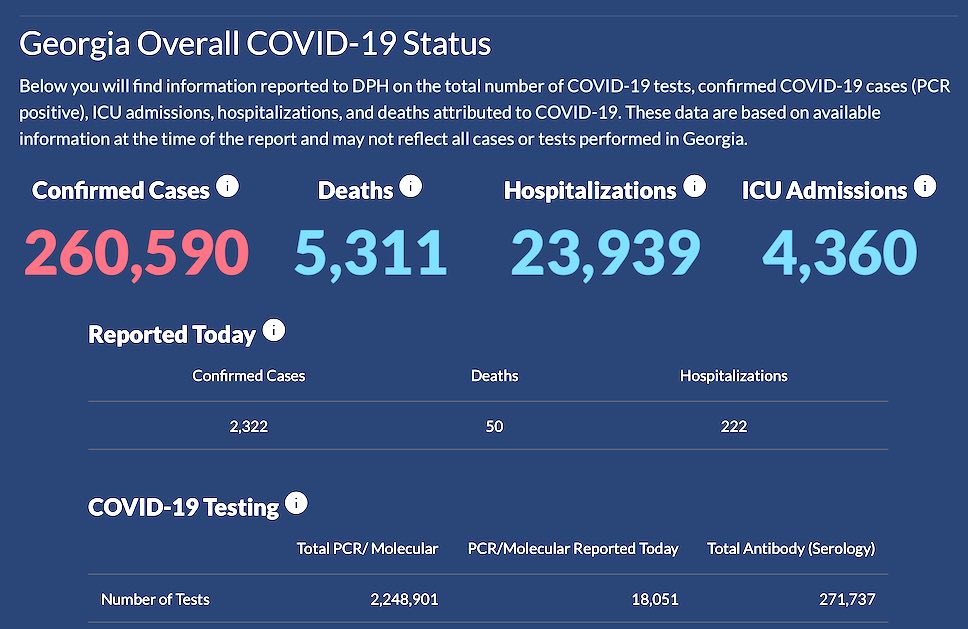
GA total cases — 260,590 (+2,236 more than the previous report of 258,354). The single-day record increase of new case reports is 4,813 on July 24. The largest daily increase previously was July 18 with 4,689 new cases.
GA deaths — 5,311 (+49 more than the previous report of 5,262). The single-day record of report numbers is 122, set Aug. 11. Death rate of confirmed cases — 2.0%
ICU admissions — 4,360 (+38 more than the previous report of 4,322). The single-day record increase of Covid-19 admissions is 85 on July 24. The previous record single-day Covid-19 admissions number was 75, set July 21.
Hospitalizations (total) — 23,939 (+222 more than the previous report of 23,717), which is 9.18% of the total cumulative confirmed cases to date. The single-day record of hospital admissions for Covid-19 is 447 on July 21. The previous daily record was 442 admissions on April 7.
GEMA hospitalizations (as of Aug. 25) — 2,260 test-confirmed Covid-19 patients are currently occupying hospital beds across Georgia, 90 fewer patients than the previous report.
Total molecular tests — 2,248,901 (+18,051 more than the previous report of 2,230,850). (Antibody tests not included because they are not used to determine the number of confirmed cases.)
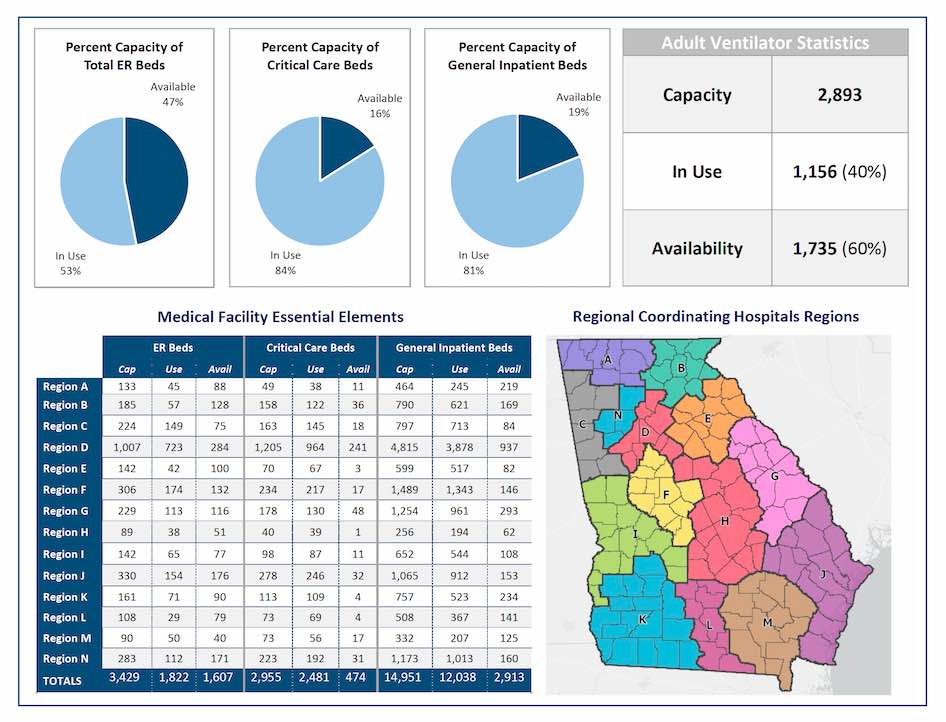
Georgia Emergency Management Agency on Aug. 25 reported 2,260 confirmed Covid-19 hospitalizations across the state, 90 fewer coronavirus patients than the previous report posted on Aug. 24. GEMA reported 474 critical care hospital beds available (16%) out of a total capacity of 2,955 beds, as well as 1,156 (40%) of the state’s available adult ventilators (2,893) in use. In addition, the state reported 1,607 (47%) available emergency room beds out of a total capacity of 3,429; and 2,913 (19%) general inpatient beds open out of a capacity of 14,951.
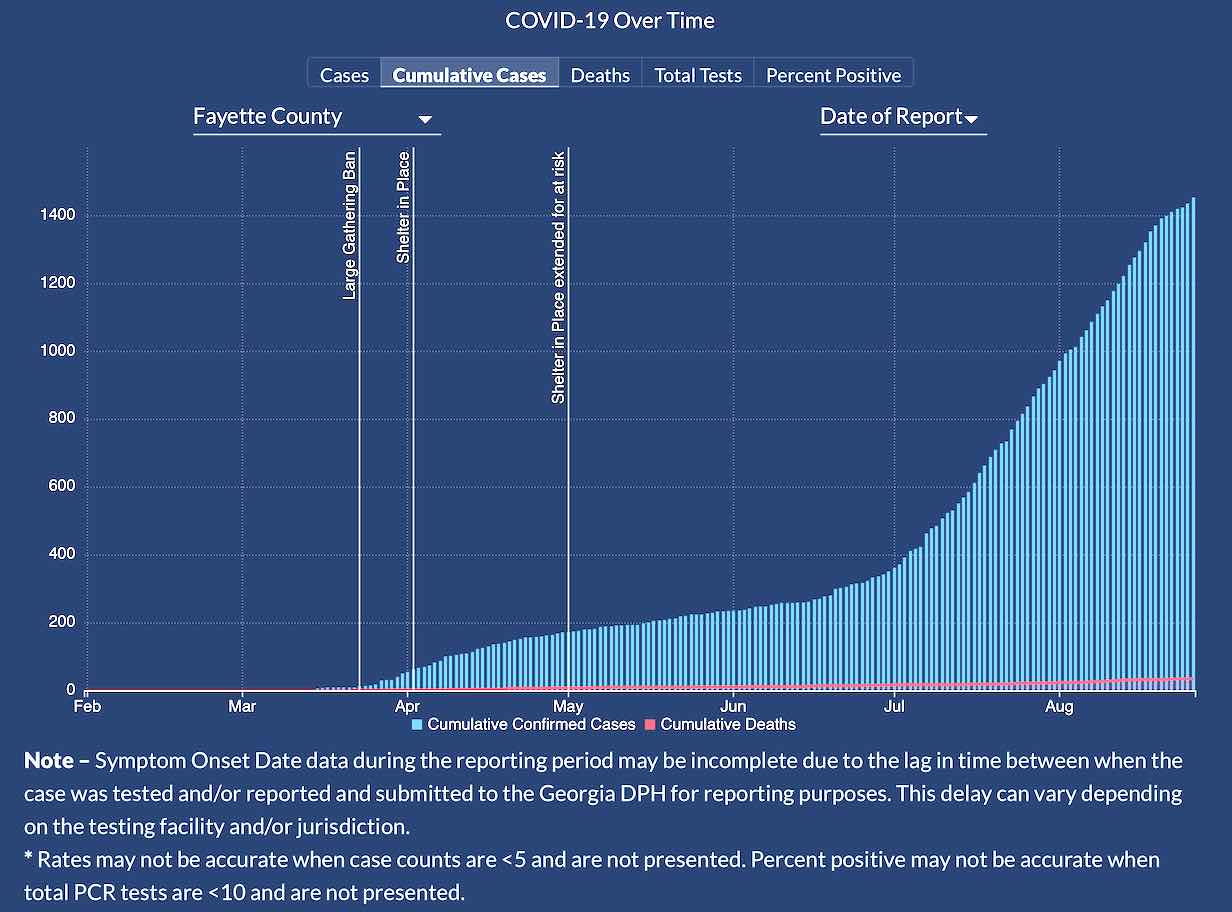
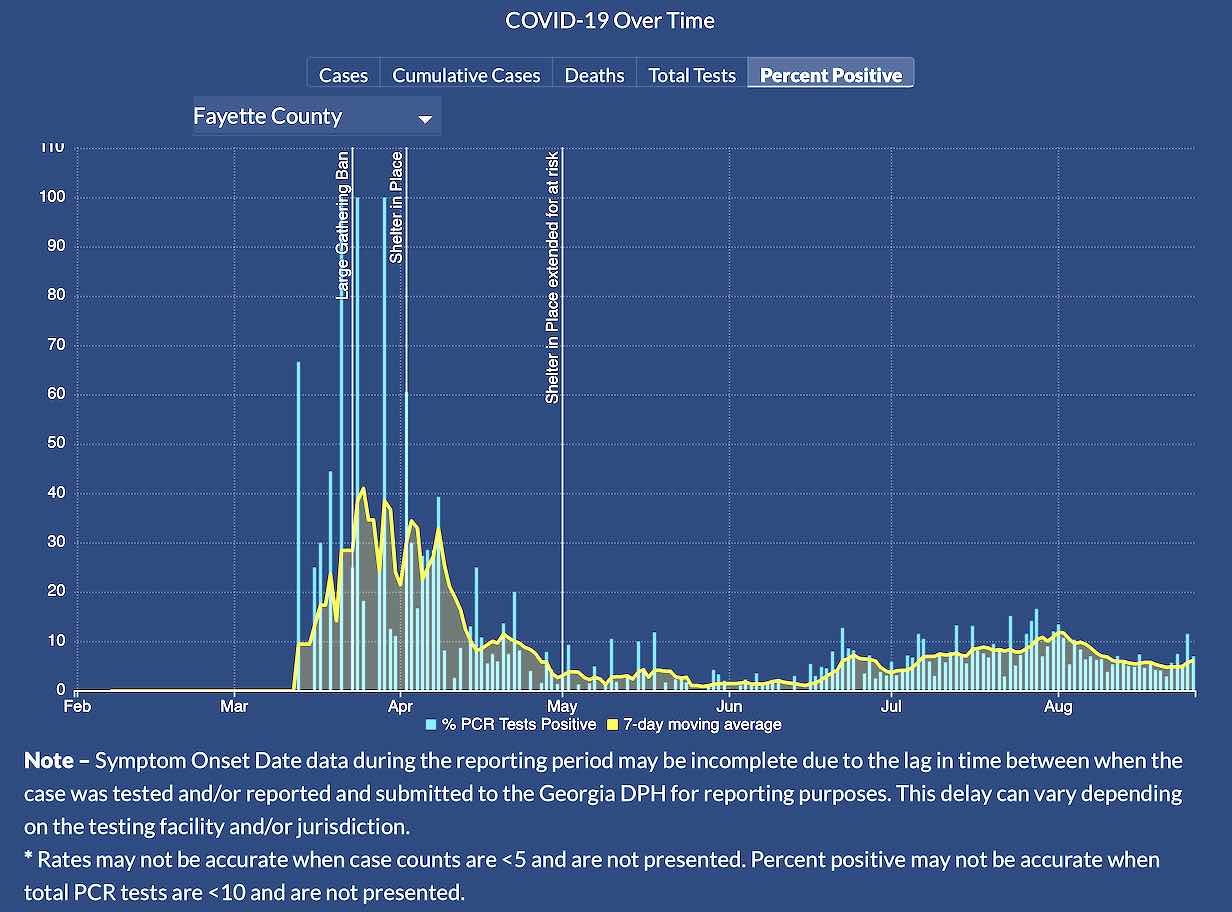
The graph below represents a Fayette County report of cumulative cases in Fayette over time (in blue) and cumulative deaths over time (the red line along the bottom of the graph). The second chart graphs the positive percentage of confirmed tests in Fayette over time.
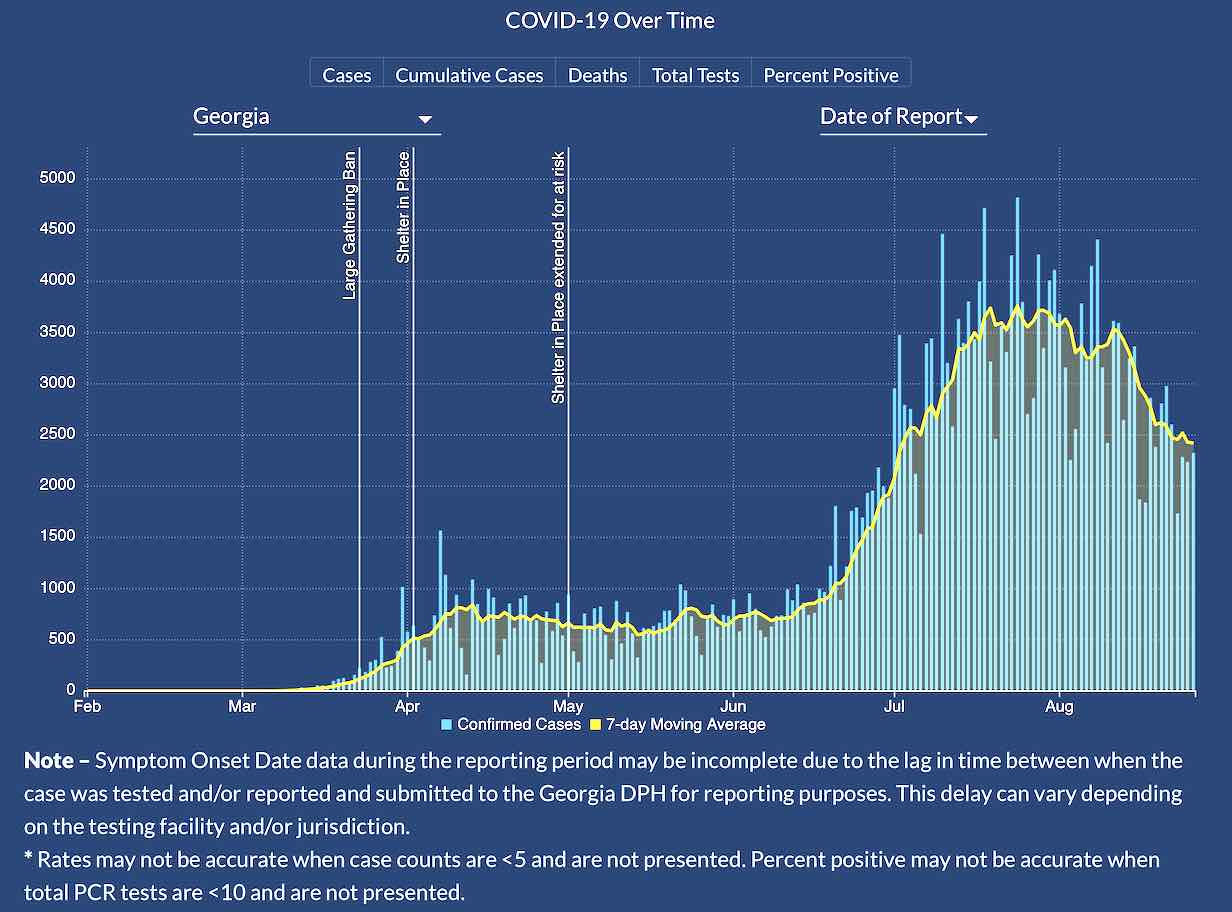
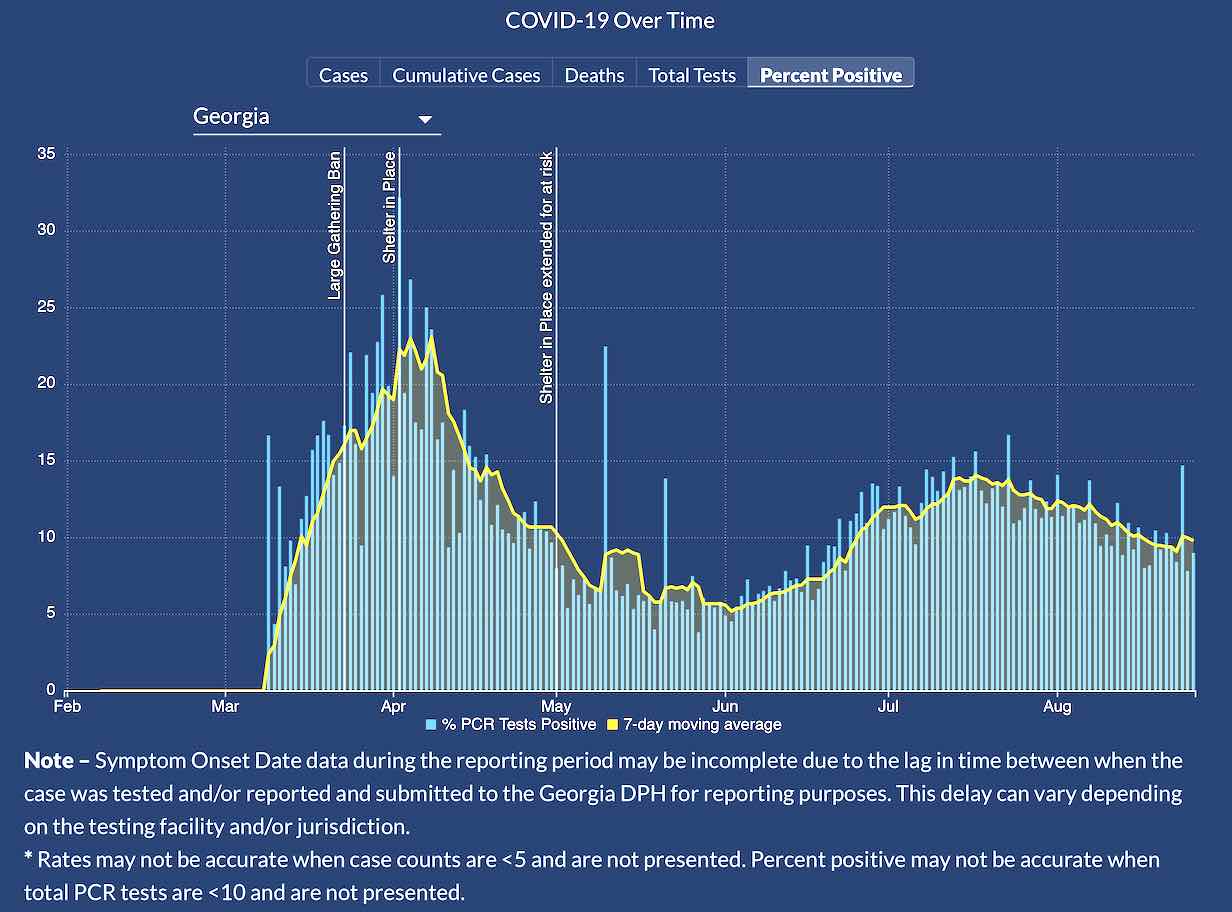
The graph below shows statewide cumulative cases over time and cumulative Covid-19 deaths over time in Georgia. The second chart graphs the positive percentage of confirmed tests in Georgia over time.
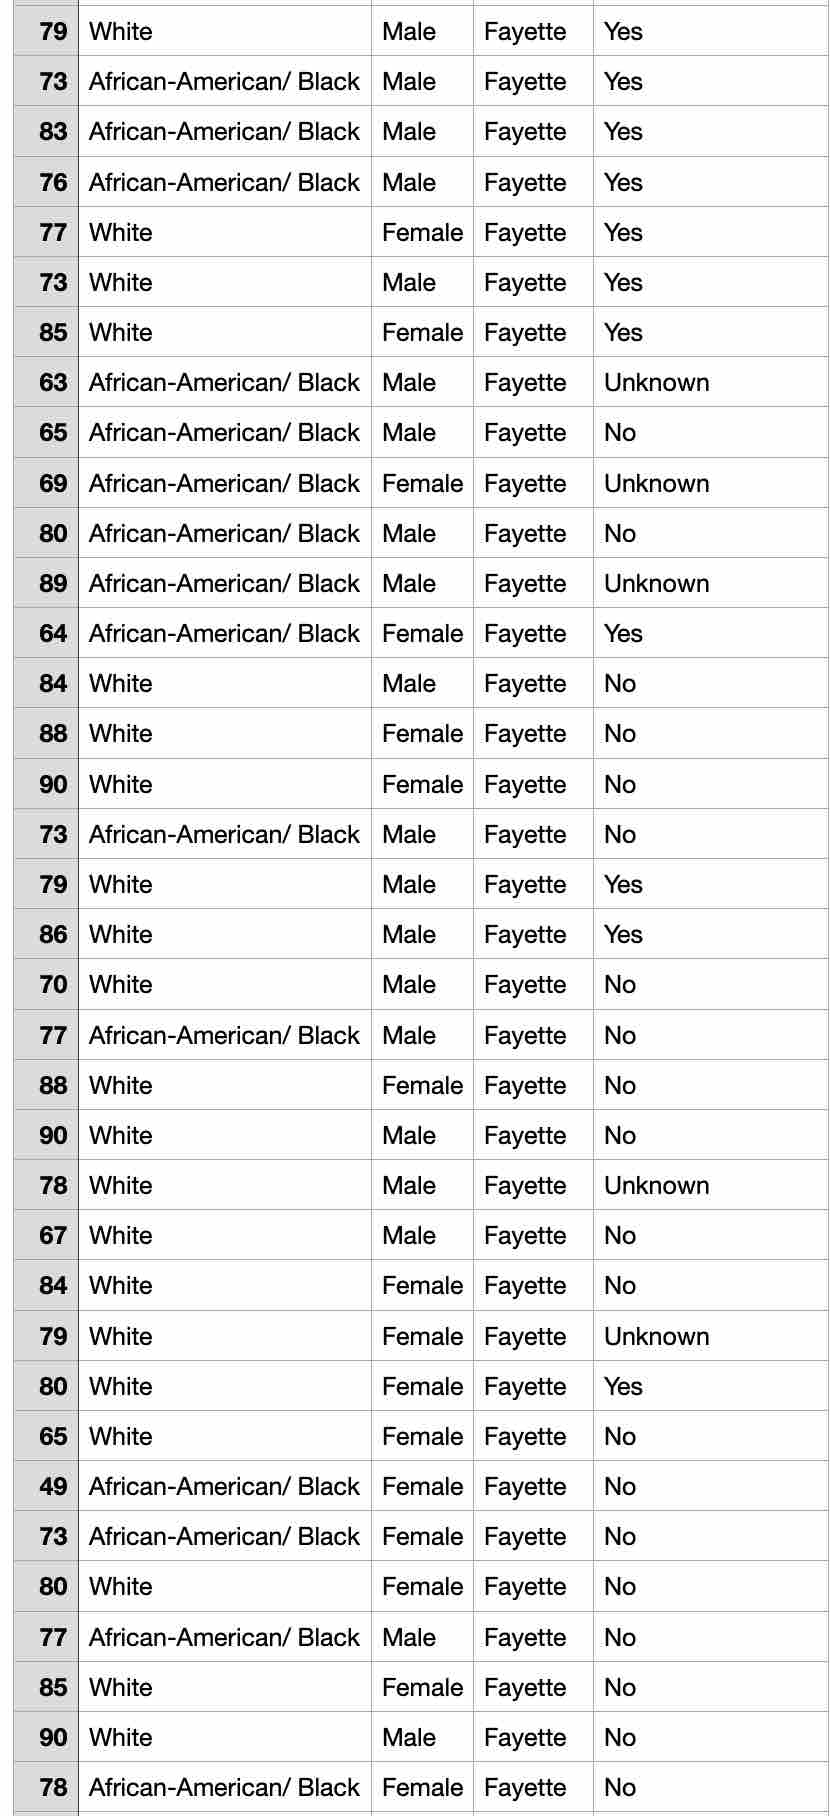
Below is a current DPH chart of reported Covid-19-related deaths that have occurred in Fayette County since the start of the pandemic. The chart is updated to reflect the latest data — 36 deaths attributed to the coronavirus. The newest fatality is a white female, age 85, with no known underlying medical conditions.
Here’s the breakdown: 10 black males, ranging from age 63 to age 89; 10 white males, ranging from 67 to 90; 11 white females from 66 to 90; and 5 black females, ranging in age from 49 to 78. There are now 3 persons aged 90 — one white female and 2 white males — who are the oldest victims of Covid-19 in Fayette County.
The chart lists from left to right the age of the victim, the race, the sex, the county, and yes or no or unknown as to whether the victim had an underlying medical condition:
Fayette County: Confirmed infections — 1,453 (19 more new cases than the previous day’s 1,434). The single-day record reported increase of new cases for Fayette is 40 on July 23. Total Covid-19 deaths: 36, unchanged from the previous report. DPH has resumed reporting the number of confirmed cases over the past two weeks. That number of new cases over the past 2 weeks is 254. Fayette’s confirmed case rate: 1,236 cases per 100,000 persons overall, and 216 for the past 2 weeks. Fayette death rate per 100,000 population: 30.6 persons. Hospitalizations: 76, 2 more than the previous report. Fayette has recorded 1,276 new Covid-19 cases since May 1. That’s an average of 10.8 new cases per day over the period since May 1. New cases since July 1 — 1,112. Fayette’s average since July 1 — 19.5 new cases a day. Fayette’s record daily increase so far is July 23 with 40 reported new cases.
Demographics of Fayette cases:
Aug. 26, 2020 Cases by Age — Age 0 to 4: 9 (+0). Age 5 to 14: 42 (+1). Age 15 to 24: 244 (+3). Age 25 to 34: 188 (+1). Age 35 to 44: 201 (+2). Age 45 to 54: 275 (+6). Age 55 to 64: 237 (+4). Age 65 to 74: 124 (+2). Age 75 to 84: 76 (+1). Age 85 Plus: 35 (+0). Age Unknown: 22 (-1). TOTAL: 1,453.
Cases by Gender — Female: 765 (+8). Male: 662 (+11). Sex Unknown: 26 (+0).
Cases by Race — White: 371 (+12). Black: 338 (+3). Asian: 13 (+0). Other: 3 (+0). Race Unknown: 728 (+4).
Cases by Ethnicity — Hispanic/Latino: 56 (+4). Non-Hispanic/Latino: 554 (+13). Ethnicity Unknown: 843 (+2).
NEW METRIC — Percentage of positive tests in Fayette:
Last 2 weeks: 5.7% positive confirmations of all persons tested. Yesterday, it was 5.7%. Two days ago, it was 5.2%. The positive rate has risen.
Overall since start of testing: 6.5%. Yesterday it was 6.5%. Two days ago, it was 6.4%.
Coweta County: Confirmed infections — 2,107 (66 more cases than the previous day’s 2,041). DPH has resumed reporting the number of cases for the past two weeks. That 2-week count is 484. Coweta is reporting 26 deaths, unchanged from the previous report. Coweta’s confirmed case rate: 1,386 cases per 100,000 persons overall, and 318 per 100K for the past 2 weeks. Coweta death rate per 100,000 population: 17.1. Hospitalizations: 107, unchanged from the previous report.
NEW METRIC — Percentage of positive tests in Coweta:
Last 2 weeks: 12.4% positive confirmations of all persons tested. Yesterday it was 11.5%. Monday it was 11.2%, Sunday it was 10.8% and 4 days ago 9.9%. The positive rate is steadily increasing.
Overall since start of testing: 8.4%. Yesterday it was 8.2%. Two days ago it was 8.2% and 3 days ago it was 8.1%.

Covid-19 in neighboring counties
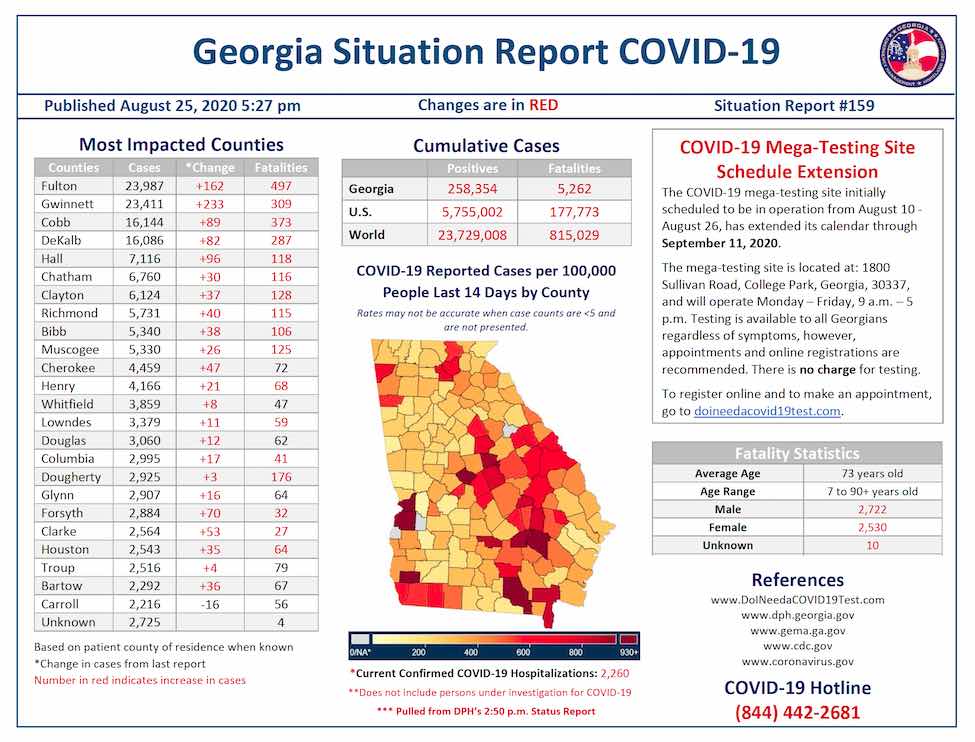
Fulton — 24,211 cases total, 497 deaths; Clayton — 6,283 cases, 128 deaths; Henry — 4,263 cases, 69 deaths; Coweta — 2,107 cases, 26 deaths; Fayette — 1,453 cases, 36 deaths; Spalding — 1,137 cases, 48 deaths.
Top 5 counties with most deaths: Fulton, 497; Cobb, 381; Gwinnett, 314; DeKalb, 287; Dougherty, 177.
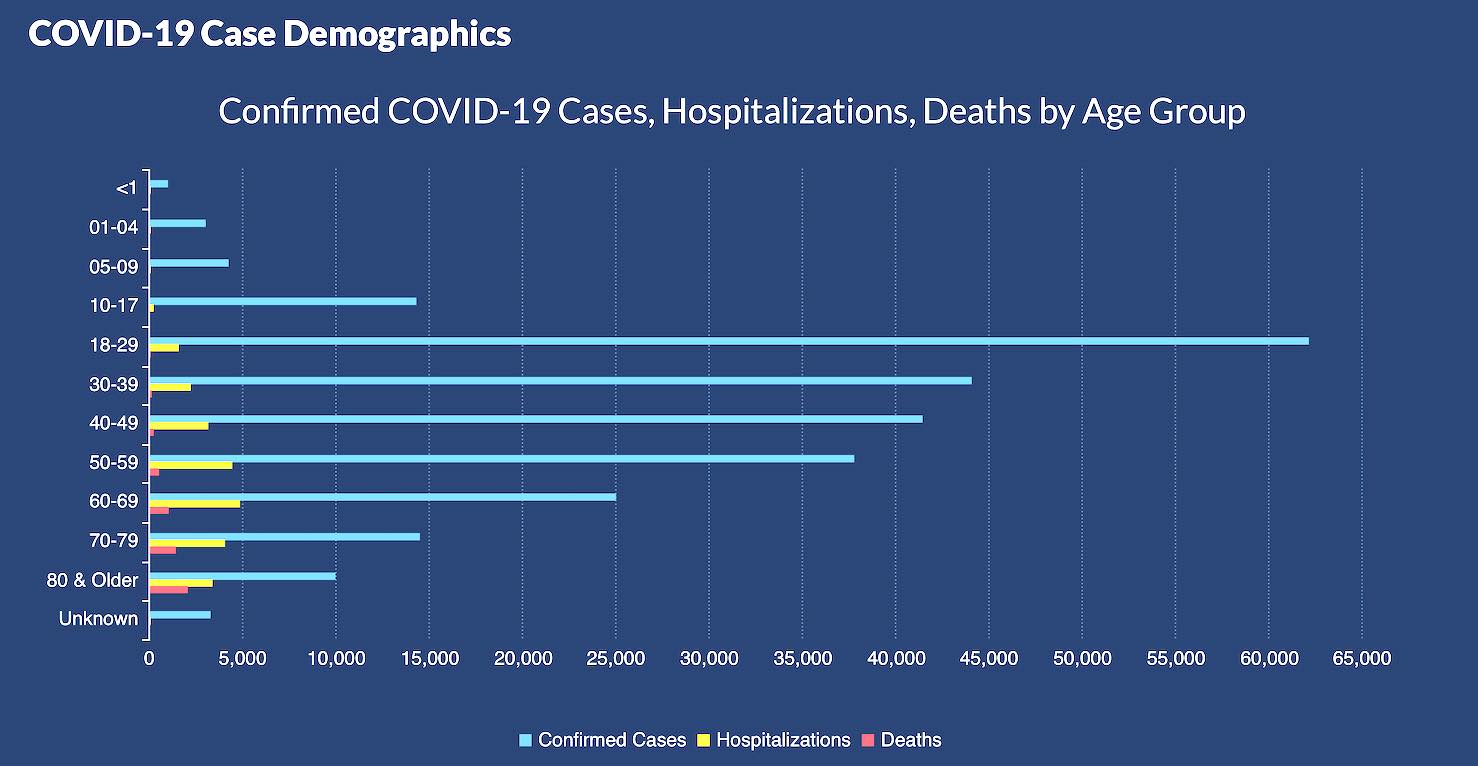
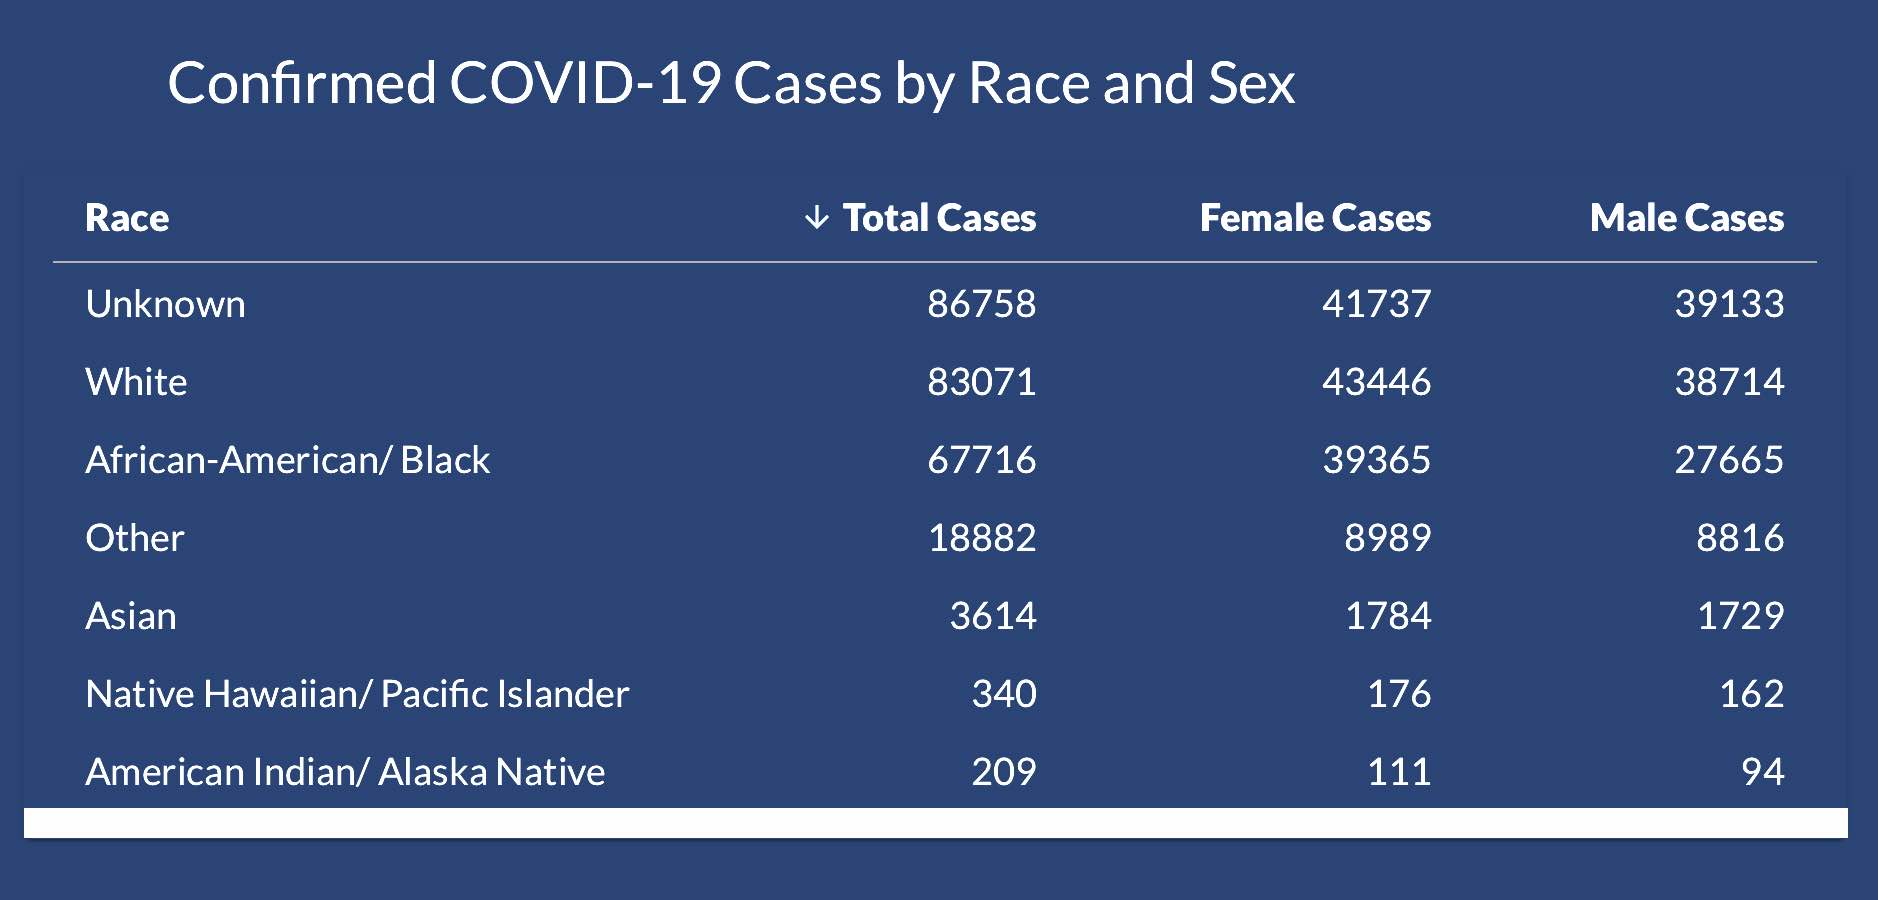
The charts below demonstrates statistics about (A) who caught the coronavirus by age group, who was hospitalized by age group, and who died by age group; and (B) cases by race and by sex.
Below is the daily progression of cumulative reported Covid-19 cases and fatalities in Fayette County:
March 9 — 1 case, no deaths
March 13 — 5 cumulative cases, no deaths
March 17 — 5 cumulative cases, no deaths
March 19 — 9 cumulative cases, no deaths
March 20 — cumulative 9 cases, 1 death (male, 83, other medical conditions)
March 22 — 9 cumulative cases, 1 death
March 23 — 10 cumulative cases, 1 death
March 24 — 12 cumulative cases, 1 death.
March 25 — 12 cumulative cases, 1 death
March 26 — 14 cumulative cases, 2 deaths (no new details provided)
March 27 — 19 cumulative cases, 2 deaths
March 28 — 25 cumulative cases, 2 deaths
March 29 — 26 cumulative cases, 3 deaths (male, 83; male, 79; female, 77; all with underlying medical conditions)
March 30 — 32 cumulative cases, 3 deaths
March 31 — 44 cumulative cases, 4 deaths (female, 51, NO underlying medical condition)
April 1 — 48 cumulative cases, 4 deaths
April 2 — 52 cumulative cases, 4 deaths
April 3 — 58 cumulative cases, 4 deaths
April 4 — 62 cumulative cases, 4 deaths
April 5 — 67 cumulative cases, 4 deaths
April 6 — 74 cumulative cases, 4 deaths
April 7 — 79 cumulative cases, 4 deaths
April 8 — 85 cumulative cases, 4 deaths
April 9 — 89 cumulative cases, 3 deaths (one fewer than reported earlier, no explanation given by DPH, though likely a reclassification of cause of death of one person)
April 10 — 92 cumulative cases, 4 deaths (subtraction yesterday and addition today unexplained by DPH)
April 11 — 94 cumulative cases (#26 in state), 4 deaths
April 12 — 99 cumulative cases (#26 in state), 4 deaths
April 13 —105 cumulative cases (#26 in state), 5 deaths
April 14 — 112 cumulative cases, (#27 in state), 5 deaths
April 15 — 120 cumulative cases (#26 in state), 5 deaths
April 16 — 123 cumulative cases (#26 in state), 5 deaths
April 17 — 133 cumulative cases (#27 in state), 5 deaths
April 18 — 135 cumulative cases (#27 in state) with 5 deaths
April 19 — 139 cumulative cases (#27 in state) with 5 deaths
April 20— 140 cumulative cases (#27 in state) with 5 deaths
April 21 — 144 cumulative cases (#28 in state) with 8 deaths
April 22 — 145 cumulative cases (#28 in state) with 8 deaths
April 23 — 152 cumulative cases (#29 in state) with 8 deaths.
April 24 — 156 cumulative cases (#29 in state) with 8 deaths.
April 25 — 158 cumulative cases (#29 in state) with 8 deaths
April 26 — 161 cumulative cases (#31 in state) with 8 deaths
April 27 — 165 cumulative cases (#30 in state) with 8 deaths.
April 28 — 170 cumulative cases with 9 deaths; 29 hospitalizations.
April 29 — 171 cumulative cases with 9 deaths; 32 hospitalizations.
April 30 — 180 cumulative cases with 10 deaths; 33 hospitalizations.
May 1 — 177 (DPH revised number) cumulative cases with 10 deaths, 33 hospitalizations
May 2 — 180 cumulative cases with 10 deaths, 35 hospitalizations
May 3 — 182 cumulative cases with 10 deaths, 35 hospitalizations
May 4 — 188 cumulative cases with 10 deaths, 35 hospitalizations
May 5 — 185 cumulative cases (unexplained decline) with 10 deaths, 35 hospitalizations
May 6 — 194 cumulative cases with 10 deaths, 36 hospitalizations
May 7 — 188 cumulative cases (unexplained decline) with 11 deaths, 36 hospitalizations.
May 8 — 190 cumulative cases with 12 deaths, 36 hospitalizations.
May 9 — 194 cumulative cases with 12 deaths, 36 hospitalizations.
May 10 — 199 cumulative cases with 12 deaths, 36 hospitalizations.
May 11 — 200 cumulative cases with 12 deaths, 36 hospitalizations.
May 12 — 201 cumulative cases with 12 deaths, 36 hospitalizations.
May 13 — 202 cumulative cases with 12 deaths, 36 hospitalizations.
May 14 — 201 cumulative cases with 11 deaths, 35 hospitalizations (unexplained subtraction of 1 case, 1 death and 1 hospitalization from county totals).
May 15 — 205 cumulative cases with 11 deaths, 35 hospitalizations.
May 16 — 206 cumulative cases with 11 deaths, 35 hospitalizations.
May 17 — 207 cumulative cases with 11 deaths, 35 hospitalizations.
May 18 — 206 cumulative cases with 11 deaths, 35 hospitalizations.
May 19 — 211 cumulative cases with 11 deaths, 35 hospitalizations.
May 20 — 214 cumulative cases with 11 deaths, 34 hospitalizations.
May 21 — 215 cumulative cases with 11 deaths, 34 hospitalizations.
May 22 — 213 cumulative cases with 11 deaths, 34 hospitalizations.
May 23 — 217 cumulative cases with 11 deaths, 35 hospitalizations.
May 24 — 220 cumulative cases with 11 deaths, 35 hospitalizations.
May 25 — 221 cumulative cases with 11 deaths, 35 hospitalizations.
May 26 — 230 cumulative cases with 13 deaths, 36 hospitalizations.
May 27 — 235 cumulative cases with 13 deaths, 36 hospitalizations.
May 28 — 230 cumulative cases with 13 deaths, 37 hospitalizations.
May 29 — 233 cumulative cases with 13 deaths, 37 hospitalizations.
May 30 — 235 cumulative cases with 13 deaths, 37 hospitalizations.
May 31 — 235 cumulative cases with 13 deaths, 37 hospitalizations.
June 1 — 235 cumulative cases with 13 deaths, 37 hospitalizations.
June 2 — 237 cumulative cases with 13 deaths, 38 hospitalizations.
June 3 — 239 cumulative cases with 13 deaths, 39 hospitalizations.
June 4 — 241 cumulative cases with 13 deaths, 40 hospitalizations.
June 5 — 244 cumulative cases with 15 deaths, 40 hospitalizations.
June 6 — 245 cumulative cases with 15 deaths, 40 hospitalizations.
June 7 — 245 cumulative cases with 15 deaths, 40 hospitalizations.
June 8 — 247 cumulative cases with 15 deaths, 40 hospitalizations.
June 9 — 254 cumulative cases with 15 deaths, 41 hospitalizations.
June 10 — 254 cumulative cases with 14 deaths, 41 hospitalizations.
June 11 — 258 cumulative cases with 14 deaths, 40 hospitalizations.
June 12 — 259 cumulative cases with 14 deaths, 40 hospitalizations.
June 13 — 260 cumulative cases with 14 deaths, 40 hospitalizations.
June 14 — 261 cumulative cases with 14 deaths, 40 hospitalizations.
June 15 — 261 cumulative cases with 15 deaths, 40 hospitalizations.
June 16 — 270 cumulative cases with 16 deaths, 40 hospitalizations.
June 17 — 271 cumulative cases with 16 deaths, 40 hospitalizations.
June 18 — 271 cumulative cases with 16 deaths, 40 hospitalizations.
June 19 — 278 cumulative cases with 16 deaths, 41 hospitalizations.
June 20 — 279 cumulative cases with 16 deaths, 41 hospitalizations.
June 21 — 280 cumulative cases with 16 deaths, 42 hospitalizations.
June 22 — 292 cumulative cases with 16 deaths, 43 hospitalizations.
June 23 — 299 cumulative cases with 16 deaths, 44 hospitalizations.
June 24 — 305 cumulative cases with 16 deaths, 45 hospitalizations.
June 25 — 314 cumulative cases with 17 deaths, 45 hospitalizations.
June 26 — 322 cumulative cases with 17 deaths, 46 hospitalizations.
June 27 — 324 cumulative cases with 17 deaths, 46 hospitalizations.
June 28 — 326 cumulative cases with 17 deaths, 46 hospitalizations.
June 29 — 326 cumulative cases with 17 deaths, 46 hospitalizations.
June 30 — 341 cumulative cases (+15, single largest day increase of the pandemic so far) with 17 deaths, 48 hospitalizations; 106 new cases since June 1.
July 1 — 346 cumulative cases (+5) with 19 deaths, 48 hospitalizations.
July 2 — 363 cumulative cases (+17, single largest daily increase so far) with 19 deaths, 48 hospitalizations.
July 3 — 384 cumulative cases (+21, single largest daily increase so far) with 19 deaths, 48 hospitalizations.
July 4 — 408 cumulative cases (+24, new record daily increase) with 19 deaths, 48 hospitalizations.
July 5 — 414 cumulative cases (+6) with 19 deaths, 48 hospitalizations.
July 6 — 422 cumulative cases (+8) with 19 deaths, 49 hospitalizations.
July 7 — 458 cumulative cases (+36 single largest daily increase so far for Fayette) with 19 deaths, 50 hospitalizations.
July 8 — 472 cumulative cases (+14) with 19 deaths, 50 hospitalizations.
July 9 — 476 cumulative cases (+4) with 19 deaths, 50 hospitalizations.
July 10 — 498 cumulative cases (+22) with 19 deaths, 49 hospitalizations.
July 11 — 509 cumulative cases (+11) with 19 deaths, 49 hospitalizations.
July 12 — 514 cumulative cases (+5) with 19 deaths, 49 hospitalizations.
July 13 — 532 cumulative cases (+18) with 19 deaths, 49 hospitalizations.
July 14 — 549 cumulative cases (+17) with 19 deaths, 49 hospitalizations.
July 15 — 565 cumulative cases (+16) with 20 deaths, 51 hospitalizations.
July 16 — 584 cumulative cases (+19) with 20 deaths, 52 hospitalizations.
July 17 — 612 cumulative cases (+28) with 20 deaths, 54 hospitalizations.
July 18 — 629 cumulative cases (+17) with 20 deaths, 56 hospitalizations.
July 19 — 654 cumulative cases (+25) with 20 deaths, 56 hospitalizations.
July 20 — 669 cumulative cases (+15) with 20 deaths, 56 hospitalizations.
July 21 — 693 cumulative cases (+24) with 21 deaths, 56 hospitalizations.
July 22 — 702 cumulative cases (+9) with 21 deaths, 56 hospitalizations.
July 23 — 742 cumulative cases (+40) with 21 deaths, 57 hospitalizations.
July 24 — 764 cumulative cases (+22) with 23 deaths, 58 hospitalizations.
July 25 — 788 cumulative cases (+24) with 23 deaths, 58 hospitalizations.
July 26 — 805 cumulative cases (+17) with 23 deaths, 58 hospitalizations.
July 27 — 825 cumulative cases (+20) with 23 deaths, 58 hospitalizations.
July 28 — 855 cumulative cases (+30) with 23 deaths, 58 hospitalizations.
July 29 — 873 cumulative cases (+18) with 24 deaths, 59 hospitalizations.
July 30 — 898 cumulative cases (+25) with 24 deaths, 61 hospitalizations.
July 31 — 918 cumulative cases (+20) with 24 deaths, 62 hospitalizations.
Aug. 1 — 949 cumulative cases (+31) with 25 deaths, 63 hospitalizations.
Aug. 2 — 970 cumulative cases (+21) with 25 deaths, 63 hospitalizations.
Aug. 3 — 980 cumulative cases (+10) with 25 deaths, 63 hospitalizations.
Aug. 4 — 994 cumulative cases (+14) with 25 deaths, 63 hospitalizations.
Aug. 5 — 1,028 cumulative cases (+34) with 25 deaths, 63 hospitalizations.
Aug. 6 — 1,047 cumulative cases (+19) with 26 deaths, 63 hospitalizations.
Aug. 7 — 1,078 cumulative cases (+31) with 28 deaths, 63 hospitalizations.
Aug. 8 — 1,100 cumulative cases (+22) with 28 deaths, 64 hospitalizations.
Aug. 9 — 1,120 cumulative cases (+20) with 28 deaths, 64 hospitalizations.
Aug. 10 — 1,131 cumulative cases (+11) with 29 deaths, 64 hospitalizations.
Aug. 11 — 1,159 cumulative cases (+28) with 30 deaths, 65 hospitalizations.
Aug. 12 — 1,187 cumulative cases (+28) with 31 deaths, 67 hospitalizations.
Aug. 13 — 1,210 cumulative cases (+23) with 32 deaths, 67 hospitalizations.
Aug. 14 — 1,243 cumulative cases (+33) with 33 deaths, 68 hospitalizations.
Aug. 15 — 1,263 cumulative cases (+20) with 33 deaths, 68 hospitalizations.
Aug. 16 — 1,277 cumulative cases (+14) with 34 deaths, 68 hospitalizations.
Aug. 17 — 1,305 cumulative cases (+28) with 34 deaths, 68 hospitalizations.
Aug. 18 — 1,341 cumulative cases (+36) with 34 deaths, 71 hospitalizations.
Aug. 19 — 1,365 cumulative cases (+24) with 34 deaths, 71 hospitalizations.
Aug. 20 — 1,388 cumulative cases (+23) with 34 deaths, 73 hospitalizations.
Aug. 21 — 1,394 cumulative cases (+6) with 34 deaths, 73 hospitalizations.
Aug. 22 — 1,404 cumulative cases (+10) with 35 deaths, 73 hospitalizations.
Aug. 23 — 1,412 cumulative cases (+8) with 36 deaths, 73 hospitalizations.
Aug. 24 — 1,419 cumulative cases (+7) with 36 deaths, 73 hospitalizations.
Aug. 25 — 1,434 cumulative cases (+15) with 36 deaths, 74 hospitalizations.
Aug. 26 — 1,453 cumulative cases (+19) with 36 deaths, 76 hospitalizations.
Here’s what the raw numbers of new hospital patients across the state of Georgia day over day look like:
• March 26 — 79 new patients, 20% increase over previous 24-hour period
• March 27 — 93 new patients, 19.9% increase over previous 24-hour period
• March 28 — 51 new patients, 9% increase over previous 24-hour period
• March 29 — 49 new patients, 7.9% increase over previous 24-hour period
• March 30 — 41 new patients, 6.1% increase over previous 24-hour period
• March 31 — 111 new patients, 15.7% increase over previous 24-hour period
• April 1 — 134 new patients, 16.3% increase over previous 24-hour period
• April 2 — 104 new patients, 10.9% increase over previous 24-hour period
• April 3 — 102 new patients, 9.6% increase over previous 24-hour period
• April 4 — 81 new patients, 6.9% increase over previous 24-hour period
• April 5 — 44 new patients, 3.5% increase over previous 24-hour period
• April 6 — 48 new patients, 3.8% increase over previous 24-hour period
• April 7 — 442 new patients, 33.1% increase over previous 24-hour period
• April 8 — 206 new patients, 11.6% increase over previous 24-hour period
• April 9 — 179 new patients, 9% increase over previous 24-hour period
• April 10 — 192 new patients, 8.8% increase over previous 24-hour period
• April 11 — 128 new patients, 5.4% increase over previous 24-hour period
• April 12 — 26 new patients, 1% increase over previous 24-hour period
• April 13 — 81 new patients, 3.29% increase over previous 24-hour period
• April 14 — 183 new patients, 7% increase over previous 24-hour period
• April 15 — 153 new patients, 5.5% increase over previous 24-hour period
• April 16 — 118 new patients, 4% increase over previous day’s report
• April 17 — 284 new patients, 9.3% increase over previous day’s report
• April 18 — 96 new patients, 2.8% increase over previous 24-hour period
• April 19 — 44 new patients, 1.2% increase over previous 24-hour period.
• April 20 — 86 new patients, 2.4% increase over previous 24-hour period.
• April 21 — 229 new patients, 6.4% increase over previous 24-hour period.
• April 22 — 180 new patients, 4.7% increase over previous 24-hour period
• April 23 — 110 new patients, 2.7% increase over previous 24-hour period.
• April 24 — 152 new patients, 3.7% increase over previous 24-hour period.
• April 25 — 105 new patients, 2.4% increase over previous 24-hour period.
• April 26 — 33 new patients, 0.01% (one-tenth of 1 percent) increase over previous 24-hour period.
• April 27 — 74 new patients, 1.6% increase over previous 24-hour period.
• April 28 — 345 new patients, 7.7% increase over previous 24-hour period.
• April 29 — 170 new patients, 3.5% increase over previous 24-hour period.
• April 30 — 162 new patients, 3.2% increase over the previous 24-hour period.
• May 1 — 108 new patients, 2.1% increase over the previous 24-hour period.
• May 2 — 122 new patients, 2.3% increase over the previous 24-hour period.
• May 3 — 53 new patients, 0.9% increase over the previous 24-hour period.
• May 4 — 36 newly hospitalized patients, increase of 0.6% over the previous day.
• May 5 — 145 newly hospitalized patients, increase of 2.6% over the previous day.
• May 6 — 135 newly hospitalized patients, increase of 2.4% over the previous day.
• May 7 — 86 newly hospitalized patients, increase of 1.5% over the previous day.
• May 8 — 91 newly hospitalized patients, increase of 1.5% over the previous day.
• May 9 — 95 newly hospitalized patients, increase of 1.6% over the previous day.
• May 10 — 13 newly hospitalized patients, increase of under 1% over the previous day.
• May 11 — 21 newly hospitalized patients, increase of less than 1% over the previous day.
• May 12 — 115 newly hospitalized patients, increase of 1.9% over the previous day.
• May 13 — 98 newly hospitalized patients, increase of 1.5% over the previous day.
• May 14 — 117 newly hospitalized patients, increase of 1.8% over the previous day.
• May 15 — 93 newly hospitalized patients, increase of 1.4% over the previous day.
• May 16 — 297 newly hospitalized patients; [new metric provided by DPH] new ICU admissions are 20, statewide.
• May 17 — 55 newly hospitalized patients; new ICU admissions are 3, statewide.
• May 18 — 126 newly hospitalized patients; new ICU admissions are 8, statewide.
• May 19 — 86 newly hospitalized patients; new ICU admissions are 19, statewide.
• May 20 — 105 newly hospitalized patients; new ICU admissions are 33, statewide.
• May 21 — 128 newly hospitalized patients; new ICU admissions are 25, statewide.
• May 22 — 78 newly hospitalized patients; new ICU admissions are 16, statewide.
• May 23 — 98 newly hospitalized patients; new ICU admissions are 20, statewide.
• May 24 — 28 newly hospitalized patients; new ICU admissions are 5, statewide.
• May 25 — 36 newly hospitalized patients; new ICU admissions are 3, statewide.
• May 26 — 72 newly hospitalized patients; new ICU admissions are 17, statewide.
• May 27 — 119 newly hospitalized patients; new ICU admissions are 32, statewide.
• May 28 — 101 newly hospitalized patients; new ICU admissions are 26, statewide.
• May 29 — 85 newly hospitalized patients; new ICU admissions are 19, statewide.
• May 30 — 69 newly hospitalized patients; new ICU admissions are 10, statewide.
• May 31 — 25 newly hospitalized patients; new ICU admissions are 4, statewide.
• June 1 — 181 newly hospitalized patients; new ICU admissions are 6, statewide.
• June 2 — 207 newly hospitalized patients; new ICU admissions are 21, statewide.
• June 3 — 85 newly hospitalized patients; new ICU admissions are 20, statewide.
• June 4 — 138 newly hospitalized patients; new ICU admissions are 31, statewide.
• June 5 — 89 newly hospitalized patients; new ICU admissions are 25, statewide.
• June 6 — 16 newly hospitalized patients; new ICU admissions are 4, statewide.
• June 7 — 23 newly hospitalized patients; new ICU admissions are 8, statewide.
• June 8 — 61 newly hospitalized patients; new ICU admissions are 16, statewide.
• June 9 — 126 newly hospitalized patients; new ICU admissions are 35, statewide.
• June 10 — 102 newly hospitalized patients; new ICU admissions are 31, statewide.
• June 11 — 99 newly hospitalized patients; new ICU admissions are 15, statewide.
• June 12 — 108 newly hospitalized patients; new ICU admissions are 15, statewide.
• June 13 — 43 newly hospitalized patients; new statewide ICU admissions are 8.
• June 14 — 24 newly hospitalized patients; new statewide ICU admissions are 5.
• June 15 — 74 newly hospitalized patients; new statewide ICU admissions are 9.
• June 16 — 132 newly hospitalized patients; new statewide ICU admissions are 22.
• June 17 — 89 newly hospitalized patients; new statewide ICU admissions are 19.
• June 18 — 120 newly hospitalized patients; new statewide ICU admissions are 25.
• June 19 — 109 newly hospitalized patients; new statewide ICU admissions are 13.
• June 20 — 65 newly hospitalized patients; new statewide ICU admissions are 18.
• June 21 — 27 newly hospitalized patients; new statewide ICU admissions are 4.
• June 22 — 89 newly hospitalized patients; new statewide ICU admissions are 11.
• June 23 — 170 newly hospitalized patients; new statewide ICU admissions are 19.
• June 24 — 190 newly hospitalized patients; new statewide ICU admissions are 32.
• June 25 — 144 newly hospitalized patients; new statewide ICU admissions are 16.
• June 26 — 148 newly hospitalized patients; new statewide ICU admissions are 22.
• June 27 — 84 newly hospitalized patients; new statewide ICU admissions are 17.
• June 28 — 22 newly hospitalized patients; new statewide ICU admissions are 7.
• June 29 — 113 newly hospitalized patients; new statewide ICU admissions are 21.
• June 30 — 227 newly hospitalized patients; new statewide ICU admissions are 34.
• July 1 — 224 newly hospitalized patients; new statewide ICU admissions are 34.
• July 2 — 225 newly hospitalized patients; new statewide ICU admissions are 32.
• July 3 — 153 newly hospitalized patients; new statewide ICU admissions are 24.
• July 4 — 90 newly hospitalized patients; new statewide ICU admissions are 12.
• July 5 — 32 newly hospitalized patients; new statewide ICU admissions are 4.
• July 6 — 144 newly hospitalized patients; new statewide ICU admissions are 12.
• July 7 — 307 newly hospitalized patients; new statewide ICU admissions are 30.
• July 8 — 274 newly hospitalized patients; new statewide ICU admissions are 31.
• July 9 — 106 newly hospitalized patients; new statewide ICU admissions are 17.
• July 10 — 331 newly hospitalized patients; new statewide ICU admissions are 46.
• July 11 — 268 newly hospitalized patients; new statewide ICU admissions are 45.
• July 12 — 54 newly hospitalized patients; new statewide ICU admissions are 11.
• July 13 — 217 newly hospitalized patients; new statewide ICU admissions are 22.
• July 14 — 209 newly hospitalized patients; new statewide ICU admissions are 19.
• July 15 — 417 newly hospitalized patients; new statewide ICU admissions are 59. The ICU admissions total of 59 is a new 1-day record.
• July 16 — 244 newly hospitalized patients; new statewide ICU admissions are 34.
• July 17 — 301 newly hospitalized patients; new statewide ICU admissions are 45.
• July 18 — 298 newly hospitalized patients; new statewide ICU admissions are 38.
• July 19 — 49 newly hospitalized patients; new statewide ICU admissions are 3.
• July 20 — 37 newly hospitalized patients; new statewide ICU admissions are 7.
• July 21 — 447 newly hospitalized patients; new statewide ICU admissions are 75. Both are new single-day records since the beginning of the pandemic.
• July 22 — 428 newly hospitalized patients; new statewide ICU admissions are 63.
• July 23 — 431 newly hospitalized patients; new statewide ICU admissions are 67.
• July 24 — 399 newly hospitalized patients; new statewide ICU admissions are 85. New daily increase record for ICU admissions.
• July 25 — 277 newly hospitalized patients; new statewide ICU admissions are 39.
• July 26 — 62 newly hospitalized patients; new statewide ICU admissions are 10.
• July 27 — 47 newly hospitalized patients; new statewide ICU admissions are 4.
• July 28 — 406 newly hospitalized patients; new statewide ICU admissions are 64.
• July 29 — 420 newly hospitalized patients; new statewide ICU admissions are 65.
• July 30 — 339 newly hospitalized patients; new statewide ICU admissions are 53.
• July 31 — 386 newly hospitalized patients; new statewide ICU admissions are 60.
• Aug. 1 — 306 newly hospitalized patients; new statewide ICU admissions are 61.
• Aug. 2 — 69 newly hospitalized patients; new statewide ICU admissions are 21.
• Aug. 3 — 60 newly hospitalized patients; new statewide ICU admissions are 16.
• Aug. 4 — 302 newly hospitalized patients; new statewide ICU admissions are 44.
• Aug. 5 — 362 newly hospitalized patients; new statewide ICU admissions are 60.
• Aug. 6 — 214 newly hospitalized patients; new statewide ICU admissions are 31.
• Aug. 7 — 280 newly hospitalized patients; new statewide ICU admissions are 53.
• Aug. 8 — 274 newly hospitalized patients; new statewide ICU admissions are 39.
• Aug. 9 — 72 newly hospitalized patients; new statewide ICU admissions are 13
• Aug. 10 — 48 newly hospitalized patients; new statewide ICU admissions are 15.
• Aug. 11 — 355 newly hospitalized patients; new statewide ICU admissions are 65.
• Aug. 12 — 348 newly hospitalized patients; new statewide ICU admissions are 97.
• Aug. 13 — 202 newly hospitalized patients; new statewide ICU admissions are 34.
• Aug. 14 —237 newly hospitalized patients; new statewide ICU admissions are 36.
• Aug. 15 —210 newly hospitalized patients; new statewide ICU admissions are 43.
• Aug. 16 —59 newly hospitalized patients; new statewide ICU admissions are 8.
• Aug. 17 —46 newly hospitalized patients; new statewide ICU admissions are 11.
• Aug. 18 —296 newly hospitalized patients; new statewide ICU admissions are 56.
• Aug. 19 — 235 newly hospitalized patients; new statewide ICU admissions are 26.
• Aug. 20 — 216 newly hospitalized patients; new statewide ICU admissions are 42.
• Aug. 21 — 245 newly hospitalized patients; new statewide ICU admissions are 33.
• Aug. 22 — 200 newly hospitalized patients; new statewide ICU admissions are 33.
• Aug. 23 — 44 newly hospitalized patients; new statewide ICU admissions are 14.
• Aug. 24 — 56 newly hospitalized patients; new statewide ICU admissions are 7.
• Aug. 25 — 292 newly hospitalized patients; new statewide ICU admissions are 50.
• Aug. 26 — 222 newly hospitalized patients; new statewide ICU admissions are 38.


Leave a Comment
You must be logged in to post a comment.