


Here’s the Covid-19 pandemic report from the Georgia Department of Public Health as of 2:50 p.m., June 24.
SUMMARY: GA total cases — 69,381 (+1,703)
GA deaths — 2,698 (+10); death rate — 3.88%
ICU admissions — 2,206 (+32); Hospitalizations (total) — 10,313 (+190); GEMA confirmed Covid-19 hospitalizations (as of June 23) — 1,059
Total tests — 886,584 (+12,461) (Includes 143,350 antibody tests).
Fayette cases — 305 (6 new cases more than the previous day’s total of 299); Fayette deaths — 16 (unchanged)
Fayette hospitalizations — 45 (1 more than the previous report)
Fayette death rate per 100K — 13.6
Fayette average new cases per day since May 1 — 2.32
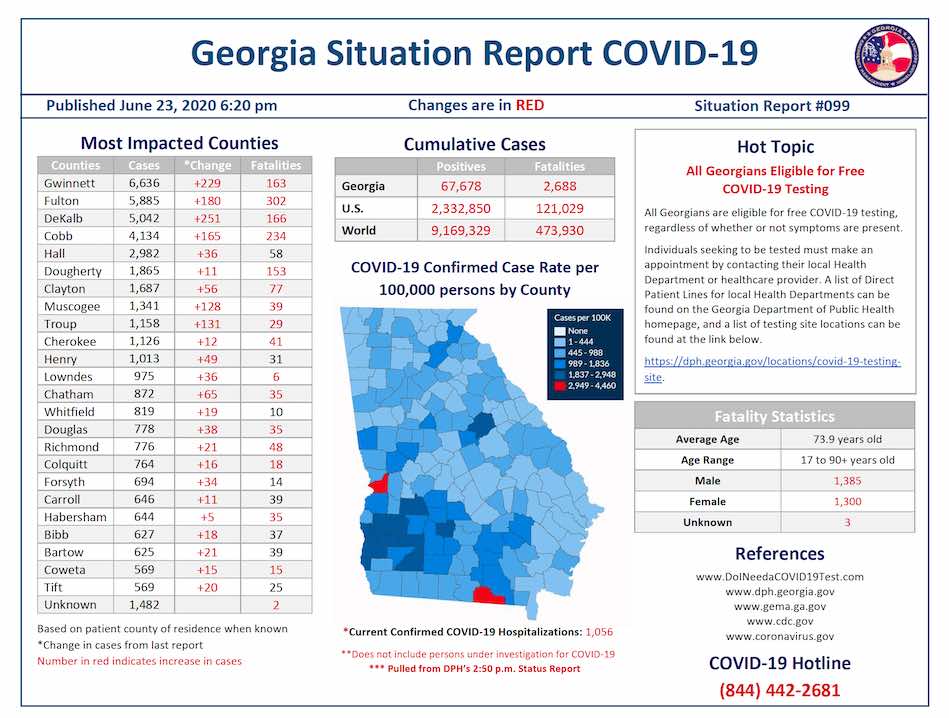
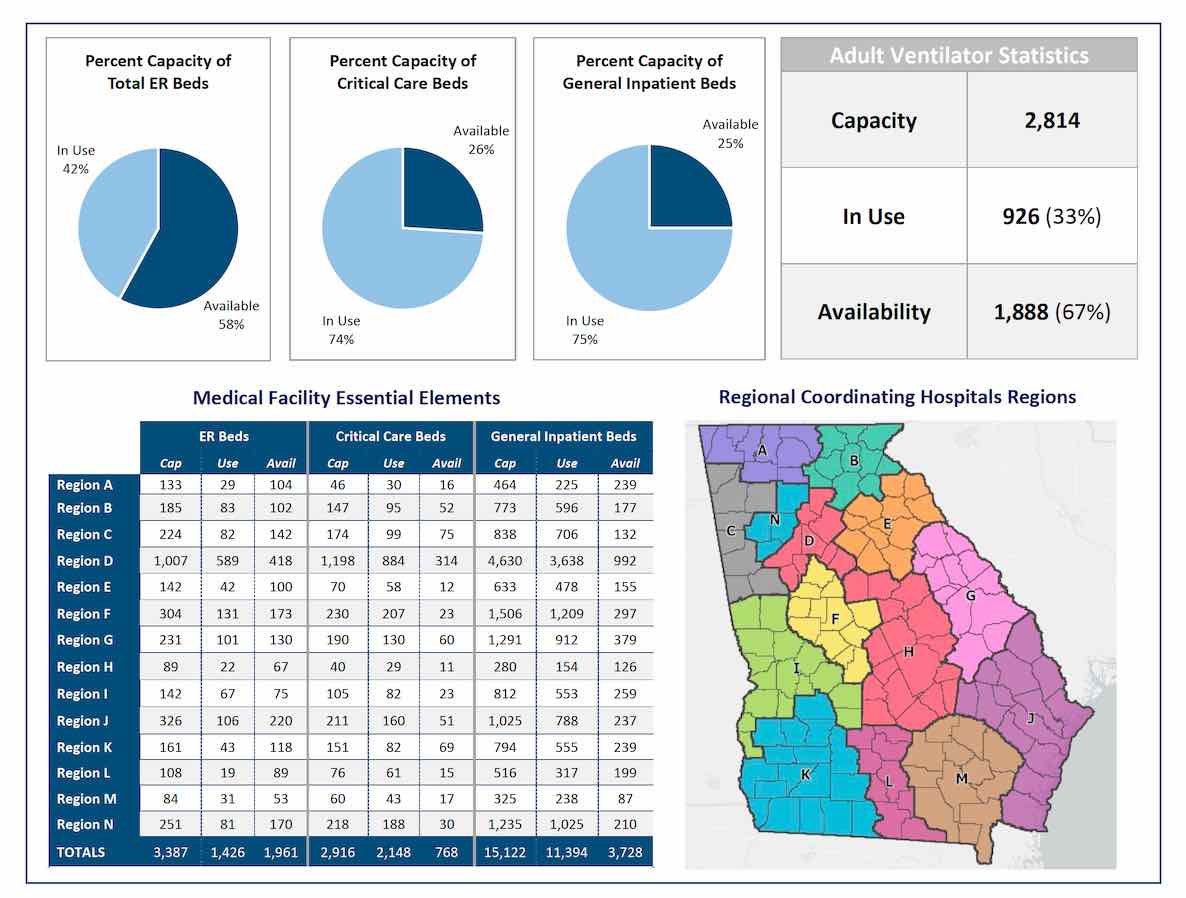
The chart below is the June 23 situation report from the Georgia Emergency Management Agency. It shows 1,056 Covid-19 hospitalizations across Georgia at the current time.
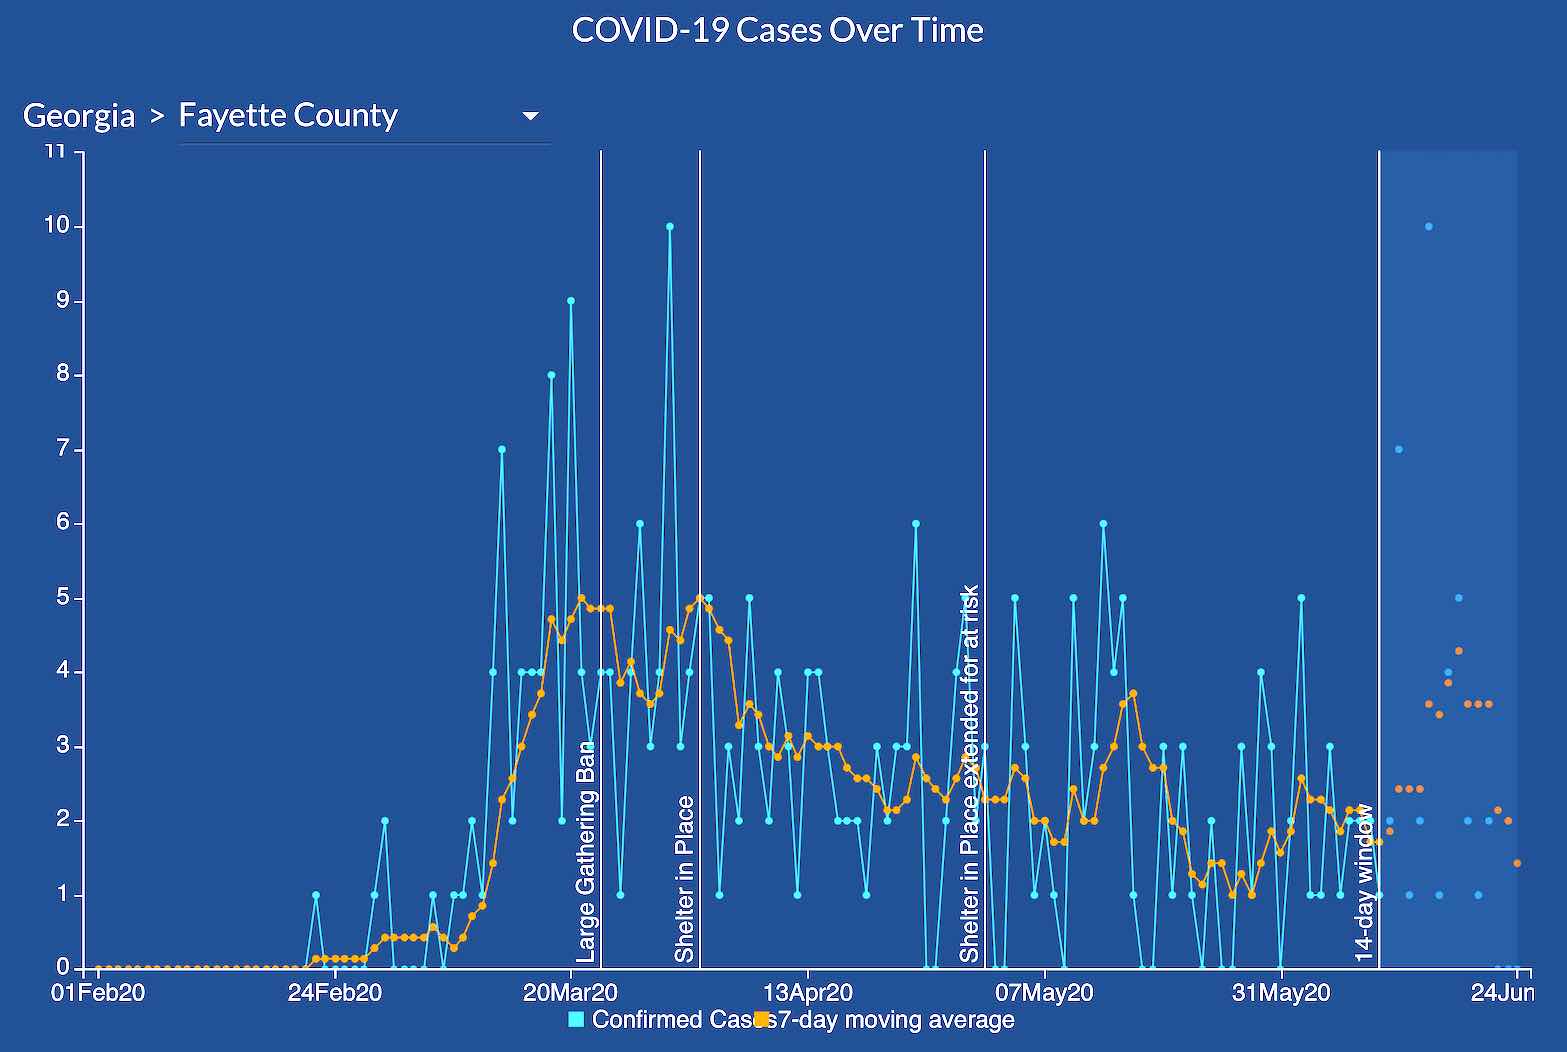
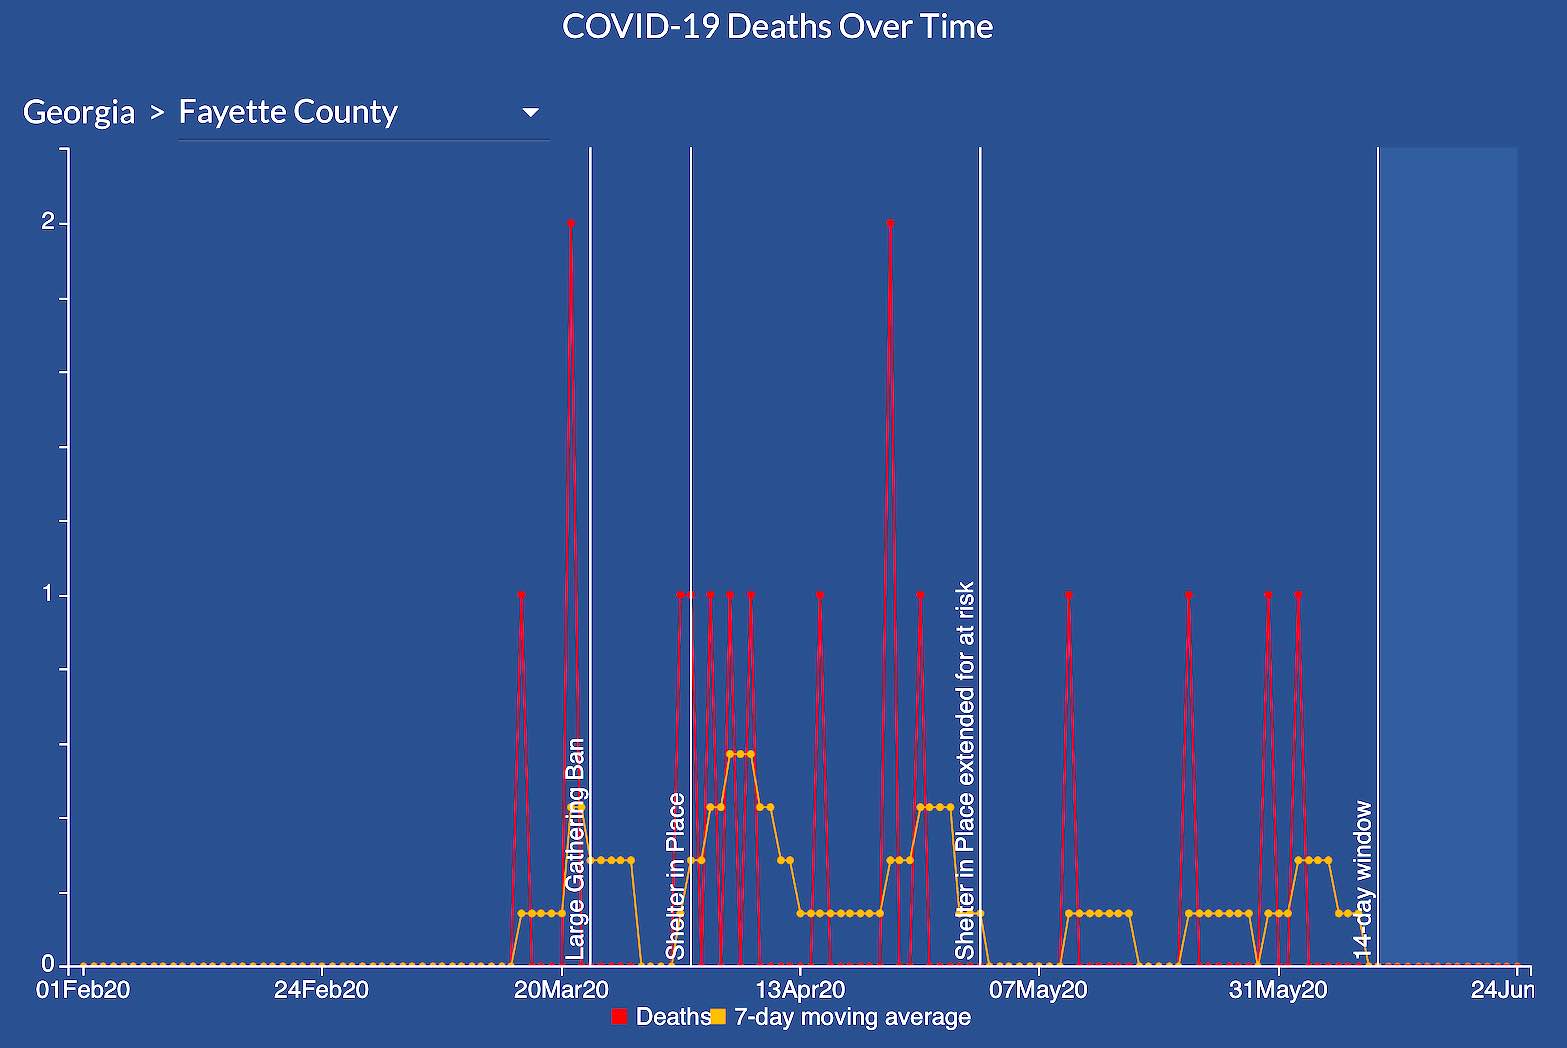
The graphs below represents a Fayette County report of cases over time in the first graph, and Fayette deaths over time just below that.
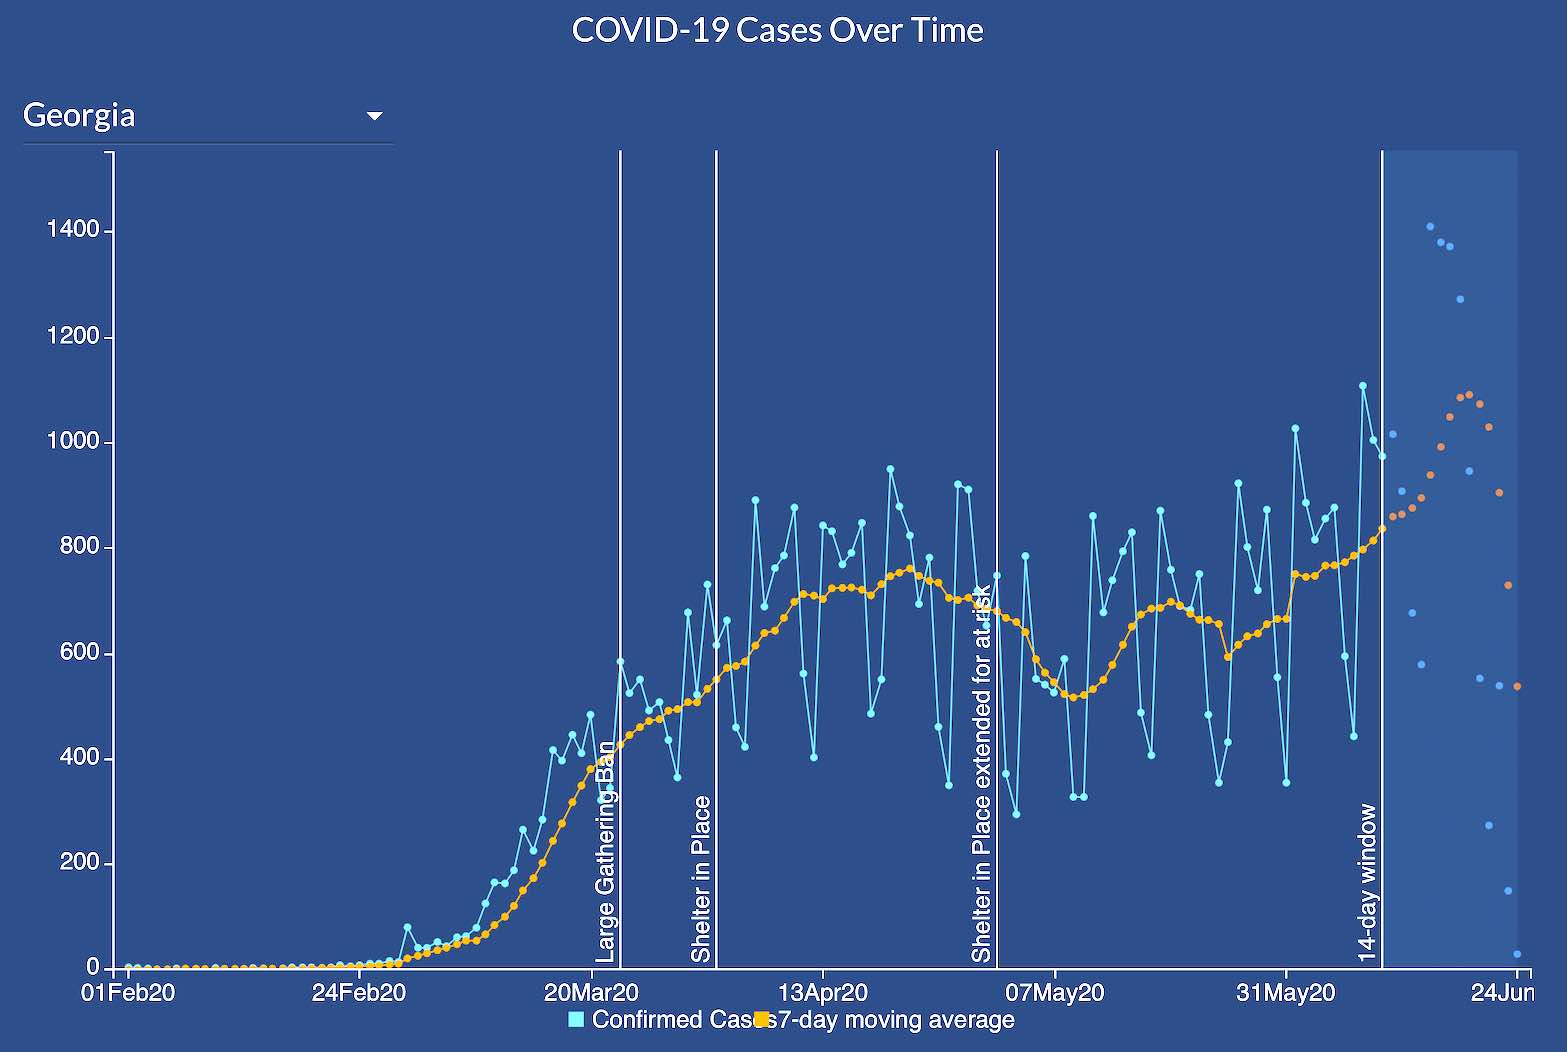
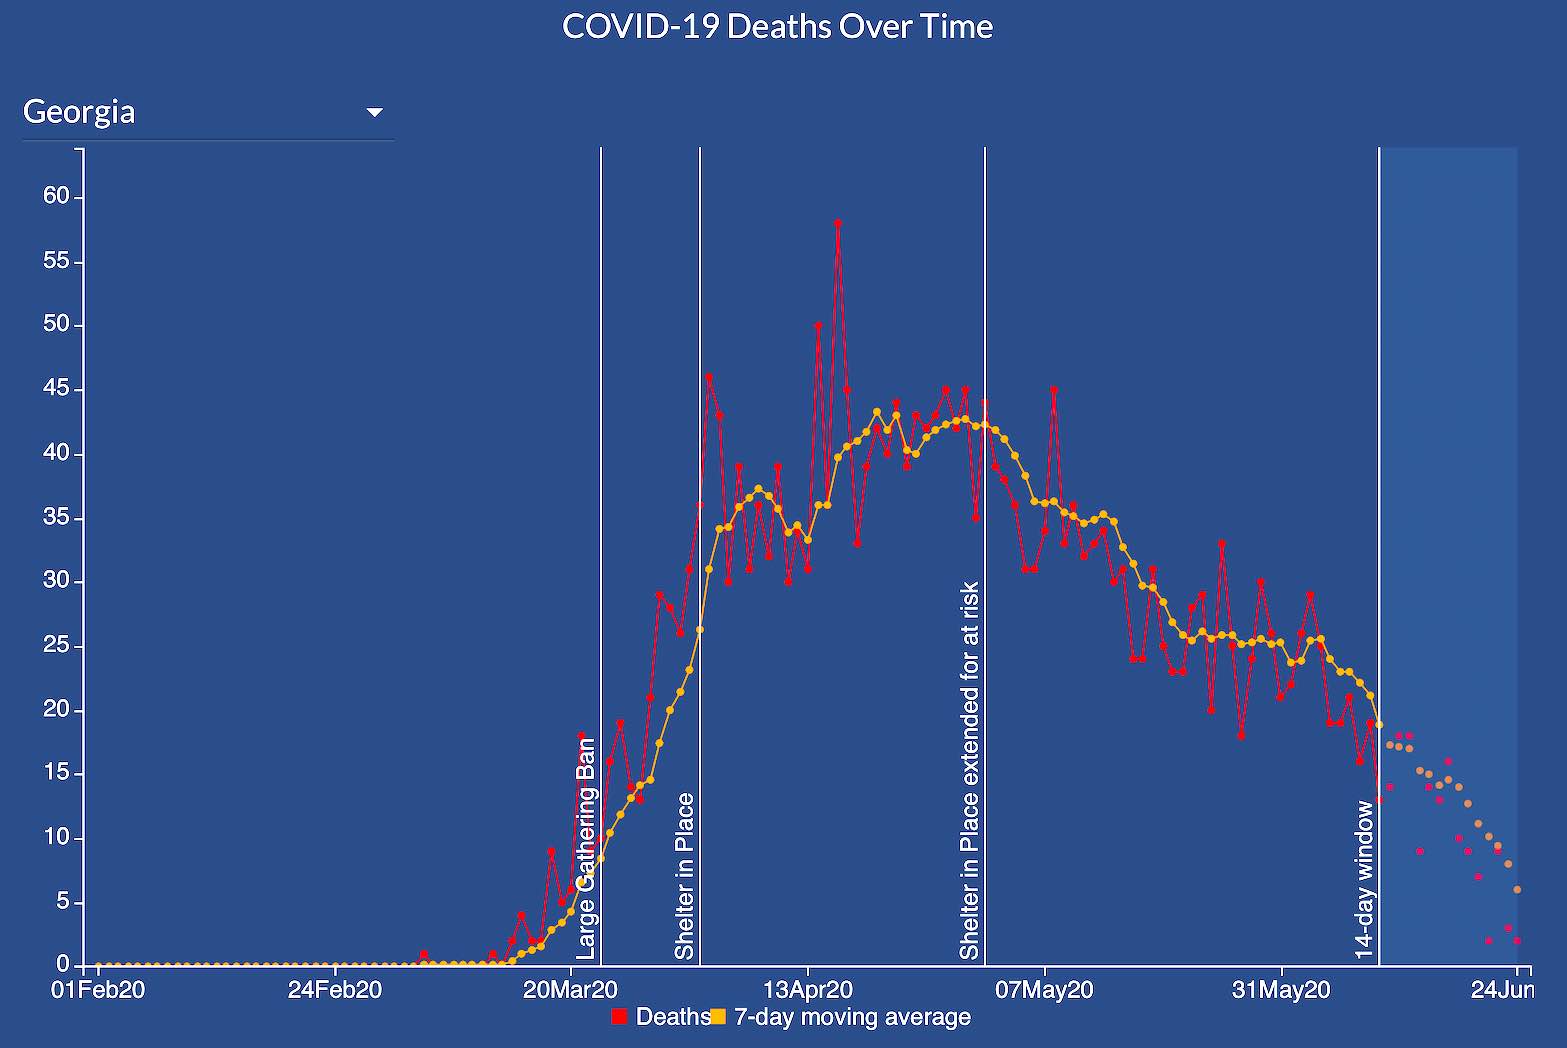
Graphs below show statewide cases over time and Covid-19 deaths over time. According to DPH, the Covid-19 cases over time “is meant to aid understanding whether the outbreak is growing, leveling off, or declining and can help to guide the Covid-19 response.”
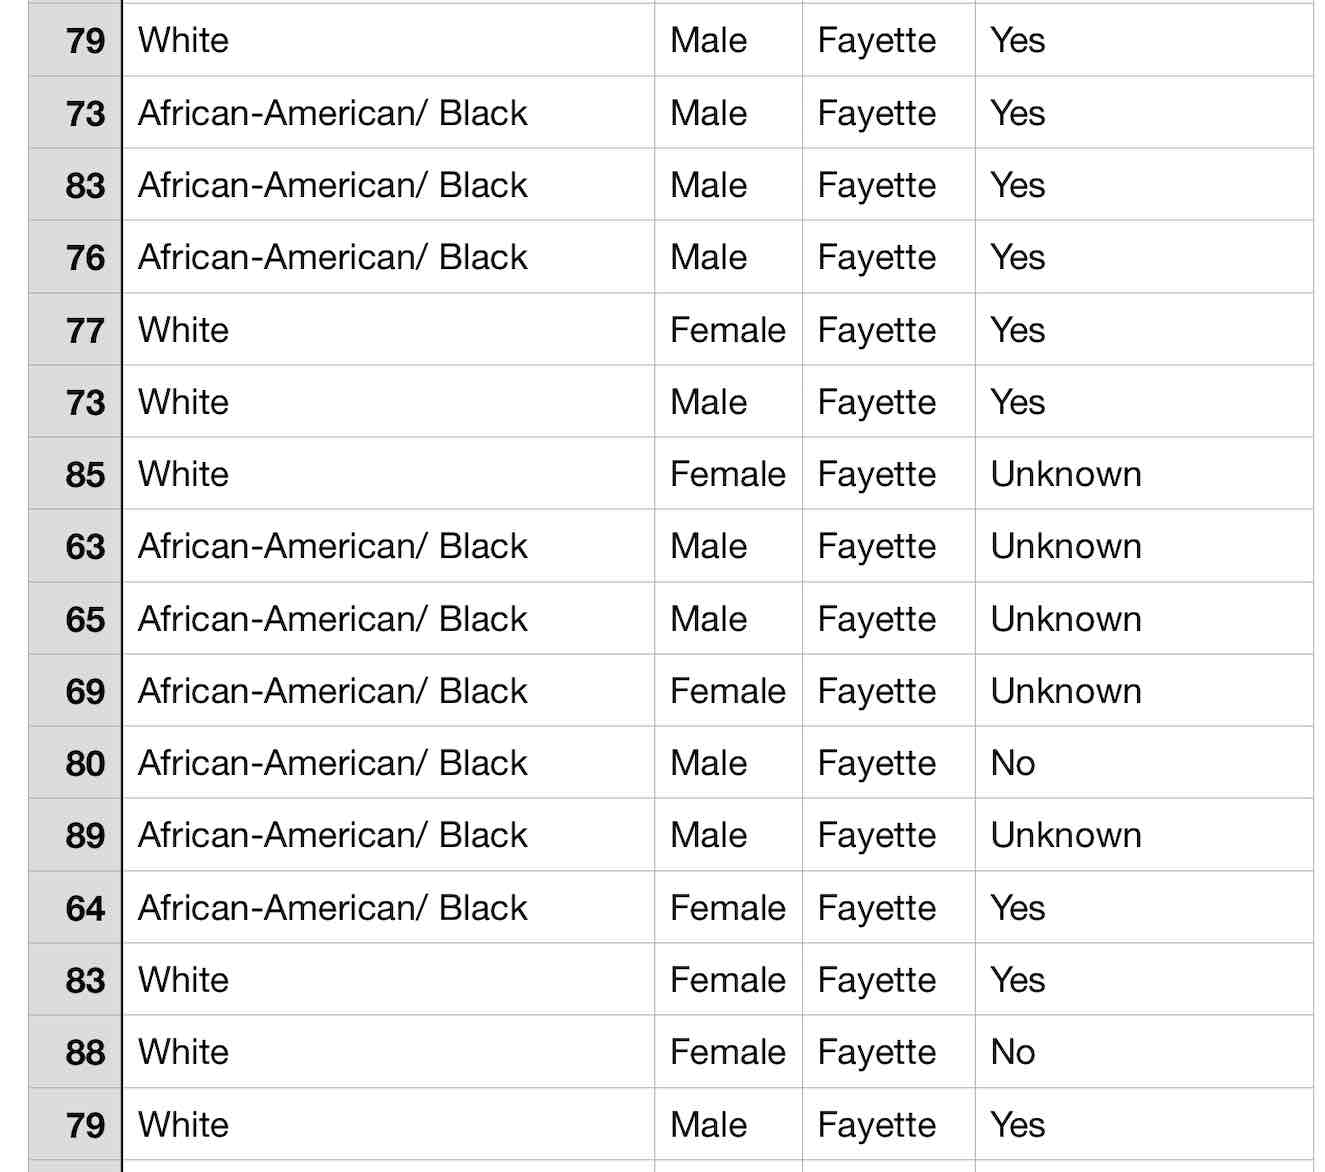
Below is a DPH chart of 16 Covid-19-related deaths that have occurred in Fayette County since the start of the pandemic.
The most recent death reported June 16 was a white female, 88, with no known co-morbidities. The day before on June 15 a white male, 73, with at least one underlying medical condition, lost his life. From the beginning of the pandemic until now, 16 Fayette residents have succumbed to the Covid-19 respiratory illness.
Here’s the breakdown: 7 black males, ages 63, 65, 73, 76, 80, 83 and 89; 2 black females, ages 64 and 69; 3 white males, ages 73, 79 and 79; and 4 white females, ages 77, 83, 85 and 88.
The chart lists from left to right the age of the victim, the race, the sex, the county, and yes or no or unknown as to whether the victim had an underlying medical condition:
Total test-confirmed cases statewide: 69,381, which is 1,703 more cases than the previous day’s total of 67,678, an increase of 2.5%. All of Georgia’s 159 counties are now reporting coronavirus cases. For perspective, more testing results in more cases being reported, which does not necessarily indicate whether a pandemic is increasing or decreasing in intensity.
Statewide deaths: 2,698, an increase of 10 fatalities over the previous day’s total of 2,688.
State Covid-19 death rate: 3.88% of all confirmed cases reported, equivalent to just under 4 deaths for every 100 test-confirmed cases.
Fayette County: Confirmed infections — 305 (6 new cases more than the previous day’s 299) with 16 deaths (unchanged). Fayette’s confirmed case rate: 259.5 cases per 100,000 persons. Fayette death rate per 100,000 population: 13.6. Hospitalizations: 45, 1 more admission than the previous report. Fayette has recorded 128 new Covid-19 cases since May 1. That’s an average of 2.32 new cases per day.
Coweta County: Confirmed infections — 599 (30 more cases than the previous day’s 569). Coweta is reporting 15 deaths (1 more fatality than the previous report). Coweta’s confirmed case rate: 394.1 cases per 100,000 persons. Coweta death rate per 100,000 population: 9.9. Hospitalizations: 55 (1 more case than the previous report).
Hospitalized: 10,313 cumulative Covid-19 hospitalizations statewide from the beginning of the pandemic to today, which is 14.8% of the total cumulative confirmed cases to date, compared to 10,123 cumulative total one day earlier, an increase of 190 newly hospitalized patients (increase of 1.8% over the previous day) across the state of Georgia. Currently being treated in hospitals on June 23 (data from GEMA) — 1,056.
Intensive care unit admissions: 2,206, which is 32 more new ICU patients than the previous day’s cumulative report of 2,174 across reporting hospitals in Georgia.
 Total coronavirus tests: 886,584 by private and state labs, which represents 12,461 (1.4%) more tests than the 874,123 tests in the previous report.
Total positive tests: 69,381 confirmations so far with all testing from both commercial and state labs, a positive confirmation rate of 7.8% of the total tests administered. The positive confirmation rate is now under 1 out of 12, meaning that more than 11 out of every 12 tests show no presence of coronavirus.
Covid-19 in neighboring counties
Fulton — 6,052 new cases, 302 deaths; Clayton — 1,726 cases, 78 deaths; Henry — 1,062 cases, 31 deaths; Coweta — 599 cases, 15 deaths; Spalding — 361 cases, 32 deaths; Fayette — 305 cases, 16 deaths.
Top 5 counties with most deaths: Fulton, 302; Cobb, 236; Gwinnett, 164; Dougherty, 153; DeKalb, 166
The chart below demonstrates statistics about who caught the coronavirus by age group, who was hospitalized by age group, and who died by age group.The fewest number of adults of any age group was those 80 and above, and they were the group with the most fatalities.

Here’s what the raw numbers of new hospital patients across the state of Georgia and the corresponding rates of hospitalization increase day over day look like:
• March 26 — 79 new patients, 20% increase over previous 24-hour period
• March 27 — 93 new patients, 19.9% increase over previous 24-hour period
• March 28 — 51 new patients, 9% increase over previous 24-hour period
• March 29 — 49 new patients, 7.9% increase over previous 24-hour period
• March 30 — 41 new patients, 6.1% increase over previous 24-hour period
• March 31 — 111 new patients, 15.7% increase over previous 24-hour period
• April 1 — 134 new patients, 16.3% increase over previous 24-hour period
• April 2 — 104 new patients, 10.9% increase over previous 24-hour period
• April 3 — 102 new patients, 9.6% increase over previous 24-hour period
• April 4 — 81 new patients, 6.9% increase over previous 24-hour period
• April 5 — 44 new patients, 3.5% increase over previous 24-hour period
• April 6 — 48 new patients, 3.8% increase over previous 24-hour period
• April 7 — 442 new patients, 33.1% increase over previous 24-hour period
• April 8 — 206 new patients, 11.6% increase over previous 24-hour period
• April 9 — 179 new patients, 9% increase over previous 24-hour period
• April 10 — 192 new patients, 8.8% increase over previous 24-hour period
• April 11 — 128 new patients, 5.4% increase over previous 24-hour period
• April 12 — 26 new patients, 1% increase over previous 24-hour period
• April 13 — 81 new patients, 3.29% increase over previous 24-hour period
• April 14 — 183 new patients, 7% increase over previous 24-hour period
• April 15 — 153 new patients, 5.5% increase over previous 24-hour period
• April 16 — 118 new patients, 4% increase over previous day’s report
• April 17 — 284 new patients, 9.3% increase over previous day’s report
• April 18 — 96 new patients, 2.8% increase over previous 24-hour period
• April 19 — 44 new patients, 1.2% increase over previous 24-hour period.
• April 20 — 86 new patients, 2.4% increase over previous 24-hour period.
• April 21 — 229 new patients, 6.4% increase over previous 24-hour period.
• April 22 — 180 new patients, 4.7% increase over previous 24-hour period
• April 23 — 110 new patients, 2.7% increase over previous 24-hour period.
• April 24 — 152 new patients, 3.7% increase over previous 24-hour period.
• April 25 — 105 new patients, 2.4% increase over previous 24-hour period.
• April 26 — 33 new patients, 0.01% (one-tenth of 1 percent) increase over previous 24-hour period.
• April 27 — 74 new patients, 1.6% increase over previous 24-hour period.
• April 28 — 345 new patients, 7.7% increase over previous 24-hour period.
• April 29 — 170 new patients, 3.5% increase over previous 24-hour period.
• April 30 — 162 new patients, 3.2% increase over the previous 24-hour period.
• May 1 — 108 new patients, 2.1% increase over the previous 24-hour period.
• May 2 — 122 new patients, 2.3% increase over the previous 24-hour period.
• May 3 — 53 new patients, 0.9% increase over the previous 24-hour period.
• May 4 — 36 newly hospitalized patients, increase of 0.6% over the previous day.
• May 5 — 145 newly hospitalized patients, increase of 2.6% over the previous day.
• May 6 — 135 newly hospitalized patients, increase of 2.4% over the previous day.
• May 7 — 86 newly hospitalized patients, increase of 1.5% over the previous day.
• May 8 — 91 newly hospitalized patients, increase of 1.5% over the previous day.
• May 9 — 95 newly hospitalized patients, increase of 1.6% over the previous day.
• May 10 — 13 newly hospitalized patients, increase of under 1% over the previous day.
• May 11 — 21 newly hospitalized patients, increase of less than 1% over the previous day.
• May 12 — 115 newly hospitalized patients, increase of 1.9% over the previous day.
• May 13 — 98 newly hospitalized patients, increase of 1.5% over the previous day.
• May 14 — 117 newly hospitalized patients, increase of 1.8% over the previous day.
• May 15 — 93 newly hospitalized patients, increase of 1.4% over the previous day.
• May 16 — 297 newly hospitalized patients; new ICU admissions are 20, statewide.
• May 17 — 55 newly hospitalized patients; new ICU admissions are 3, statewide.
• May 18 — 126 newly hospitalized patients; new ICU admissions are 8, statewide.
• May 19 — 86 newly hospitalized patients; new ICU admissions are 19, statewide.
• May 20 — 105 newly hospitalized patients; new ICU admissions are 33, statewide.
• May 21 — 128 newly hospitalized patients; new ICU admissions are 25, statewide.
• May 22 — 78 newly hospitalized patients; new ICU admissions are 16, statewide.
• May 23 — 98 newly hospitalized patients; new ICU admissions are 20, statewide.
• May 24 — 28 newly hospitalized patients; new ICU admissions are 5, statewide.
• May 25 — 36 newly hospitalized patients; new ICU admissions are 3, statewide.
• May 26 — 72 newly hospitalized patients; new ICU admissions are 17, statewide.
• May 27 — 119 newly hospitalized patients; new ICU admissions are 32, statewide.
• May 28 — 101 newly hospitalized patients; new ICU admissions are 26, statewide.
• May 29 — 85 newly hospitalized patients; new ICU admissions are 19, statewide.
• May 30 — 69 newly hospitalized patients; new ICU admissions are 10, statewide.
• May 31 — 25 newly hospitalized patients; new ICU admissions are 4, statewide.
• June 1 — 181 newly hospitalized patients; new ICU admissions are 6, statewide.
• June 2 — 207 newly hospitalized patients; new ICU admissions are 21, statewide.
• June 3 — 85 newly hospitalized patients; new ICU admissions are 20, statewide.
• June 4 — 138 newly hospitalized patients; new ICU admissions are 31, statewide.
• June 5 — 89 newly hospitalized patients; new ICU admissions are 25, statewide.
• June 6 — 16 newly hospitalized patients; new ICU admissions are 4, statewide.
• June 7 — 23 newly hospitalized patients; new ICU admissions are 8, statewide.
• June 8 — 61 newly hospitalized patients; new ICU admissions are 16, statewide.
• June 9 — 126 newly hospitalized patients; new ICU admissions are 35, statewide.
• June 10 — 102 newly hospitalized patients; new ICU admissions are 31, statewide.
• June 11 — 99 newly hospitalized patients; new ICU admissions are 15, statewide.
• June 12 — 108 newly hospitalized patients; new ICU admissions are 15, statewide.
• June 13 — 43 newly hospitalized patients; new statewide ICU admissions are 8.
• June 14 — 24 newly hospitalized patients; new statewide ICU admissions are 5.
• June 15 — 74 newly hospitalized patients; new statewide ICU admissions are 9.
• June 16 — 132 newly hospitalized patients; new statewide ICU admissions are 22.
• June 17 — 89 newly hospitalized patients; new statewide ICU admissions are 19.
• June 18 — 120 newly hospitalized patients; new statewide ICU admissions are 25.
• June 19 — 109 newly hospitalized patients; new statewide ICU admissions are 13.
• June 20 — 65 newly hospitalized patients; new statewide ICU admissions are 18.
• June 21 — 27 newly hospitalized patients; new statewide ICU admissions are 4.
• June 22 — 89 newly hospitalized patients; new statewide ICU admissions are 11.
• June 23 — 170 newly hospitalized patients; new statewide ICU admissions are 19.
• June 24 — 190 newly hospitalized patients; new statewide ICU admissions are 32.
Below is the daily progression of cumulative reported Covid-19 cases and fatalities in Fayette County:
March 9 — 1 case, no deaths
March 13 — 5 cumulative cases, no deaths
March 17 — 5 cumulative cases, no deaths
March 19 — 9 cumulative cases, no deaths
March 20 — cumulative 9 cases, 1 death (male, 83, other medical conditions)
March 22 — 9 cumulative cases, 1 death
March 23 — 10 cumulative cases, 1 death
March 24 — 12 cumulative cases, 1 death.
March 25 — 12 cumulative cases, 1 death
March 26 — 14 cumulative cases, 2 deaths (no new details provided)
March 27 — 19 cumulative cases, 2 deaths
March 28 — 25 cumulative cases, 2 deaths
March 29 — 26 cumulative cases, 3 deaths (male, 83; male, 79; female, 77; all with underlying medical conditions)
March 30 — 32 cumulative cases, 3 deaths
March 31 — 44 cumulative cases, 4 deaths (female, 51, NO underlying medical condition)
April 1 — 48 cumulative cases, 4 deaths
April 2 — 52 cumulative cases, 4 deaths
April 3 — 58 cumulative cases, 4 deaths
April 4 — 62 cumulative cases, 4 deaths
April 5 — 67 cumulative cases, 4 deaths
April 6 — 74 cumulative cases, 4 deaths
April 7 — 79 cumulative cases, 4 deaths
April 8 — 85 cumulative cases, 4 deaths
April 9 — 89 cumulative cases, 3 deaths (one fewer than reported earlier, no explanation given by DPH, though likely a reclassification of cause of death of one person)
April 10 — 92 cumulative cases, 4 deaths (subtraction yesterday and addition today unexplained by DPH)
April 11 — 94 cumulative cases (#26 in state), 4 deaths
April 12 — 99 cumulative cases (#26 in state), 4 deaths
April 13 —105 cumulative cases (#26 in state), 5 deaths
April 14 — 112 cumulative cases, (#27 in state), 5 deaths
April 15 — 120 cumulative cases (#26 in state), 5 deaths
April 16 — 123 cumulative cases (#26 in state), 5 deaths
April 17 — 133 cumulative cases (#27 in state), 5 deaths
April 18 — 135 cumulative cases (#27 in state) with 5 deaths
April 19 — 139 cumulative cases (#27 in state) with 5 deaths
April 20— 140 cumulative cases (#27 in state) with 5 deaths
April 21 — 144 cumulative cases (#28 in state) with 8 deaths
April 22 — 145 cumulative cases (#28 in state) with 8 deaths
April 23 — 152 cumulative cases (#29 in state) with 8 deaths.
April 24 — 156 cumulative cases (#29 in state) with 8 deaths.
April 25 — 158 cumulative cases (#29 in state) with 8 deaths
April 26 — 161 cumulative cases (#31 in state) with 8 deaths
April 27 — 165 cumulative cases (#30 in state) with 8 deaths.
April 28 — 170 cumulative cases with 9 deaths; 29 hospitalizations.
April 29 — 171 cumulative cases with 9 deaths; 32 hospitalizations.
April 30 — 180 cumulative cases with 10 deaths; 33 hospitalizations.
May 1 — 177 (DPH revised number) cumulative cases with 10 deaths, 33 hospitalizations
May 2 — 180 cumulative cases with 10 deaths, 35 hospitalizations
May 3 — 182 cumulative cases with 10 deaths, 35 hospitalizations
May 4 — 188 cumulative cases with 10 deaths, 35 hospitalizations
May 5 — 185 cumulative cases (unexplained decline) with 10 deaths, 35 hospitalizations
May 6 — 194 cumulative cases with 10 deaths, 36 hospitalizations
May 7 — 188 cumulative cases (unexplained decline) with 11 deaths, 36 hospitalizations.
May 8 — 190 cumulative cases with 12 deaths, 36 hospitalizations.
May 9 — 194 cumulative cases with 12 deaths, 36 hospitalizations.
May 10 — 199 cumulative cases with 12 deaths, 36 hospitalizations.
May 11 — 200 cumulative cases with 12 deaths, 36 hospitalizations.
May 12 — 201 cumulative cases with 12 deaths, 36 hospitalizations.
May 13 — 202 cumulative cases with 12 deaths, 36 hospitalizations.
May 14 — 201 cumulative cases with 11 deaths, 35 hospitalizations (unexplained subtraction of 1 case, 1 death and 1 hospitalization from county totals).
May 15 — 205 cumulative cases with 11 deaths, 35 hospitalizations.
May 16 — 206 cumulative cases with 11 deaths, 35 hospitalizations.
May 17 — 207 cumulative cases with 11 deaths, 35 hospitalizations.
May 18 — 206 cumulative cases with 11 deaths, 35 hospitalizations.
May 19 — 211 cumulative cases with 11 deaths, 35 hospitalizations.
May 20 — 214 cumulative cases with 11 deaths, 34 hospitalizations.
May 21 — 215 cumulative cases with 11 deaths, 34 hospitalizations.
May 22 — 213 cumulative cases with 11 deaths, 34 hospitalizations.
May 23 — 217 cumulative cases with 11 deaths, 35 hospitalizations.
May 24 — 220 cumulative cases with 11 deaths, 35 hospitalizations.
May 25 — 221 cumulative cases with 11 deaths, 35 hospitalizations.
May 26 — 230 cumulative cases with 13 deaths, 36 hospitalizations.
May 27 — 235 cumulative cases with 13 deaths, 36 hospitalizations.
May 28 — 230 cumulative cases with 13 deaths, 37 hospitalizations.
May 29 — 233 cumulative cases with 13 deaths, 37 hospitalizations.
May 30 — 235 cumulative cases with 13 deaths, 37 hospitalizations.
May 31 — 235 cumulative cases with 13 deaths, 37 hospitalizations.
June 1 — 235 cumulative cases with 13 deaths, 37 hospitalizations.
June 2 — 237 cumulative cases with 13 deaths, 38 hospitalizations.
June 3 — 239 cumulative cases with 13 deaths, 39 hospitalizations.
June 4 — 241 cumulative cases with 13 deaths, 40 hospitalizations.
June 5 — 244 cumulative cases with 15 deaths, 40 hospitalizations.
June 6 — 245 cumulative cases with 15 deaths, 40 hospitalizations.
June 7 — 245 cumulative cases with 15 deaths, 40 hospitalizations.
June 8 — 247 cumulative cases with 15 deaths, 40 hospitalizations.
June 9 — 254 cumulative cases with 15 deaths, 41 hospitalizations.
June 10 — 254 cumulative cases with 14 deaths, 41 hospitalizations.
June 11 — 258 cumulative cases with 14 deaths, 40 hospitalizations.
June 12 — 259 cumulative cases with 14 deaths, 40 hospitalizations.
June 13 — 260 cumulative cases with 14 deaths, 40 hospitalizations.
June 14 — 261 cumulative cases with 14 deaths, 40 hospitalizations.
June 15 — 261 cumulative cases with 15 deaths, 40 hospitalizations.
June 16 — 270 cumulative cases with 16 deaths, 40 hospitalizations.
June 17 — 271 cumulative cases with 16 deaths, 40 hospitalizations.
June 18 — 271 cumulative cases with 16 deaths, 40 hospitalizations.
June 19 — 278 cumulative cases with 16 deaths, 41 hospitalizations.
June 20 — 279 cumulative cases with 16 deaths, 41 hospitalizations.
June 21 — 280 cumulative cases with 16 deaths, 42 hospitalizations.
June 22 — 292 cumulative cases with 16 deaths, 43 hospitalizations.
June 23 — 299 cumulative cases with 16 deaths, 44 hospitalizations.
June 24 — 305 cumulative cases with 16 deaths, 45 hospitalizations.


Leave a Comment
You must be logged in to post a comment.