


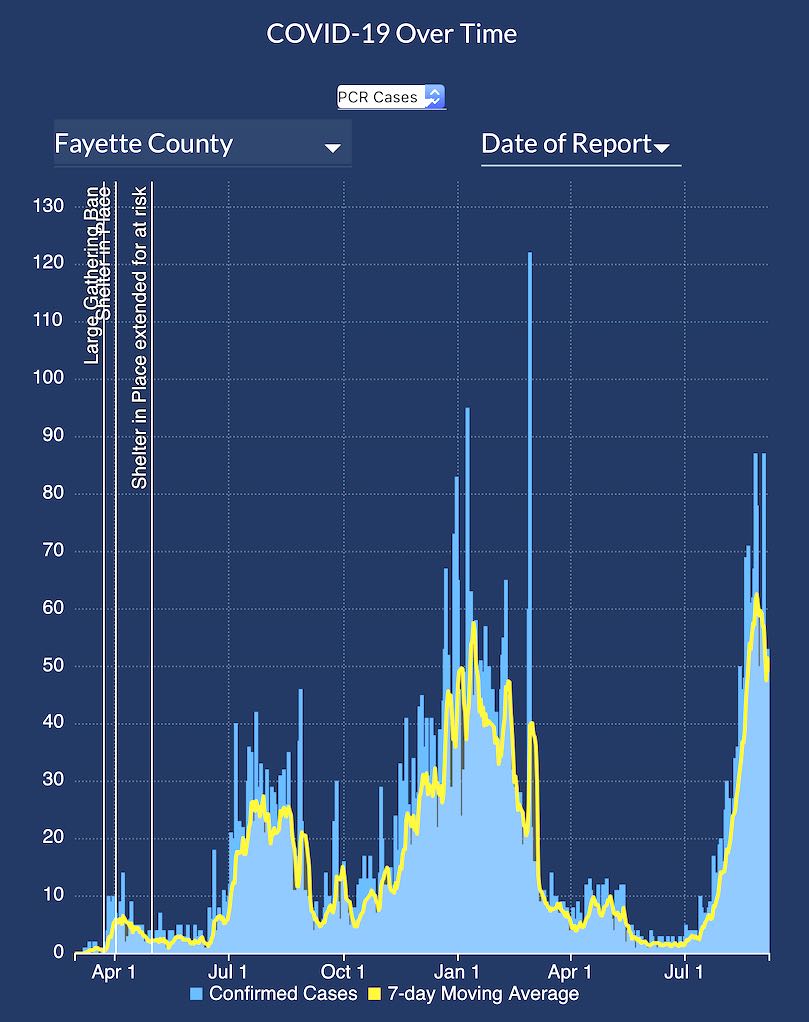
Fayette County’s steady rise in one closely watched metric now has reversed its course and is headed in a more hopeful direction, according to data from the Georgia Department of Public Health.
The 2-week average of confirmed positive test results topped out Sept. 3 at 7.5% in testing of Fayette residents, DPH data showed, after a daily increase from a late June-early July 2-week average of 0.2%, which represented a yearly low.
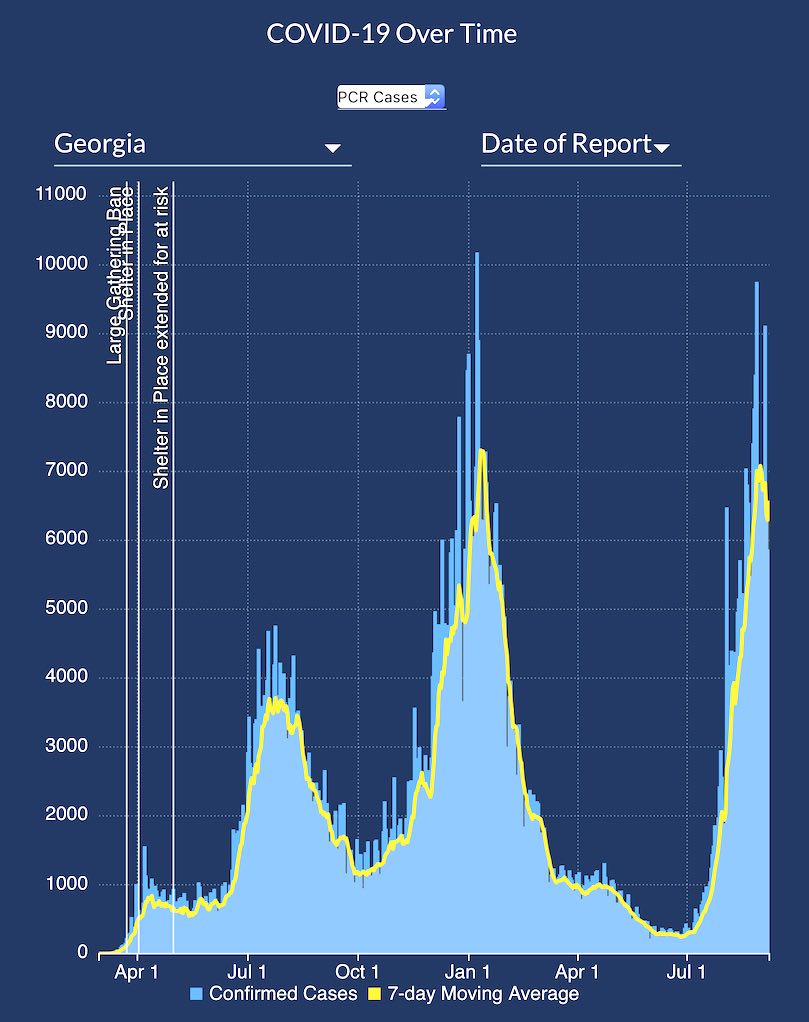
Fayette’s 2-week rate as of Sept. 7, DPH said, was 6.3%. Neighboring Coweta County — already at pandemic high rates — fell under 20% for the first time since Aug. 9.
Covid cases in Fayette went up 34 to 8,665 for the pandemic total, compared to 52 the previous day. Hospitalizations of Fayette residents with Covid now stand at a pandemic total of 424, while Fayette fatalities are at 172 deaths.
Fayette leads the state in vaccination percentages with 56% of the county’s population now listed as fully vaccinated.
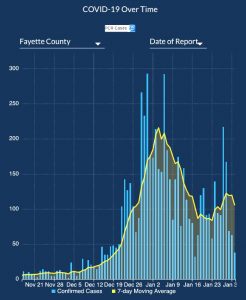
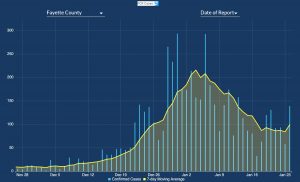
The 2 graphs below show the case number trend in the whole state and also the number of Covid hospital admissions and their percentage of the total number of hospitalized patients.


Leave a Comment
You must be logged in to post a comment.