


4 Fayette residents die from Covid-19 this week —
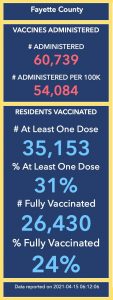
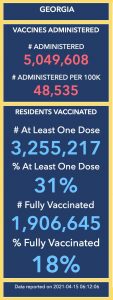
More than 3 out of every 10 Fayette residents have received at least one Covid-19 vaccination injection as of mid-April, according to a chart from the Georgia Department of Public Health. That’s a total of 35,153 with at least some immunity.
Of that number, 26,430 — or 24% — are “fully vaccinated,” DPH reports.
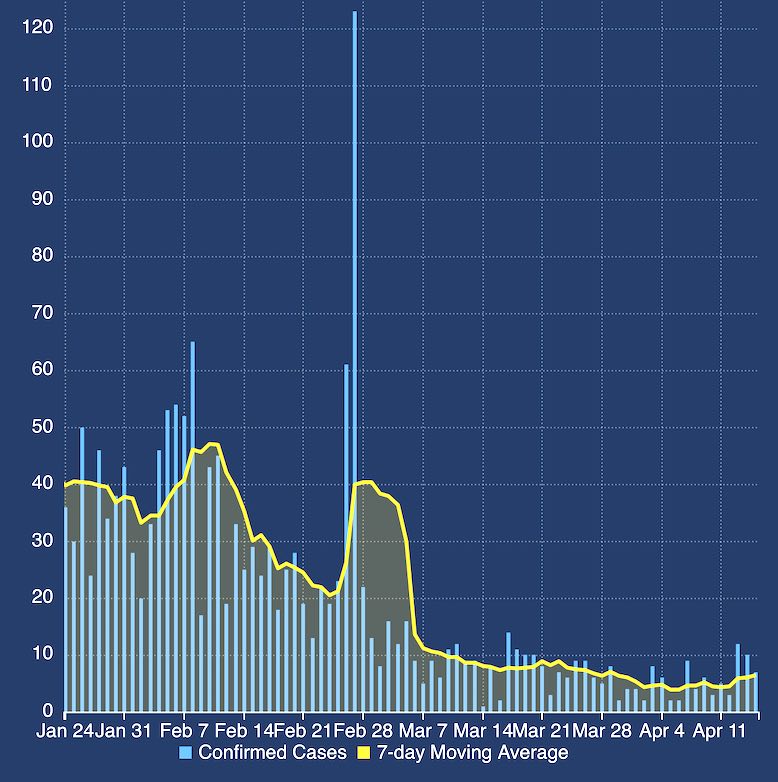
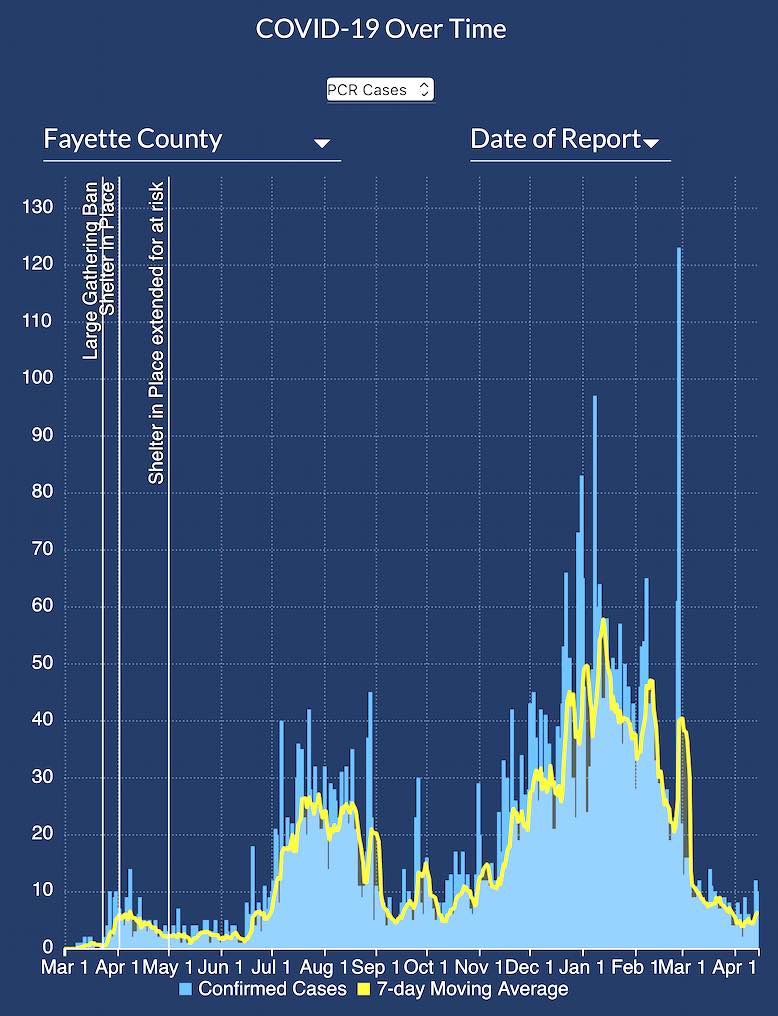
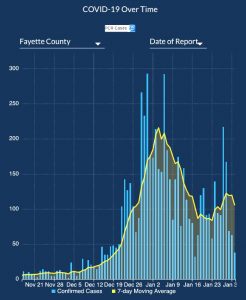
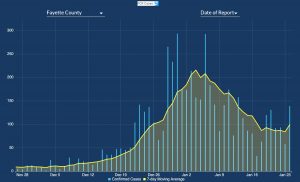
While new coronavirus infections are relatively low this week in Fayette County — 35 since last Saturday — Covid-19 has claimed the lives of 4 residents, 3 in one day.
In addition, Fayette’s 2-week positive test confirmation rate ticked up slightly from 3.0% April 11 to 4.2% on April 15, DPR data showed. The 2-week numbers rose from the low 60s Sunday to 79 by Thursday.
The Wednesday report from the Georgia Department of Public Health added the following to the death toll: a 90-year-old white male and a 63-year-old white female, both with no other medical conditions; and a 40-year-old Hispanic white male with an underlying medical conditions.
On April 12, DPR reported the death of a 42-year-old African-American male with an underlying medical condition. that brings the county pandemic death toll to 151.
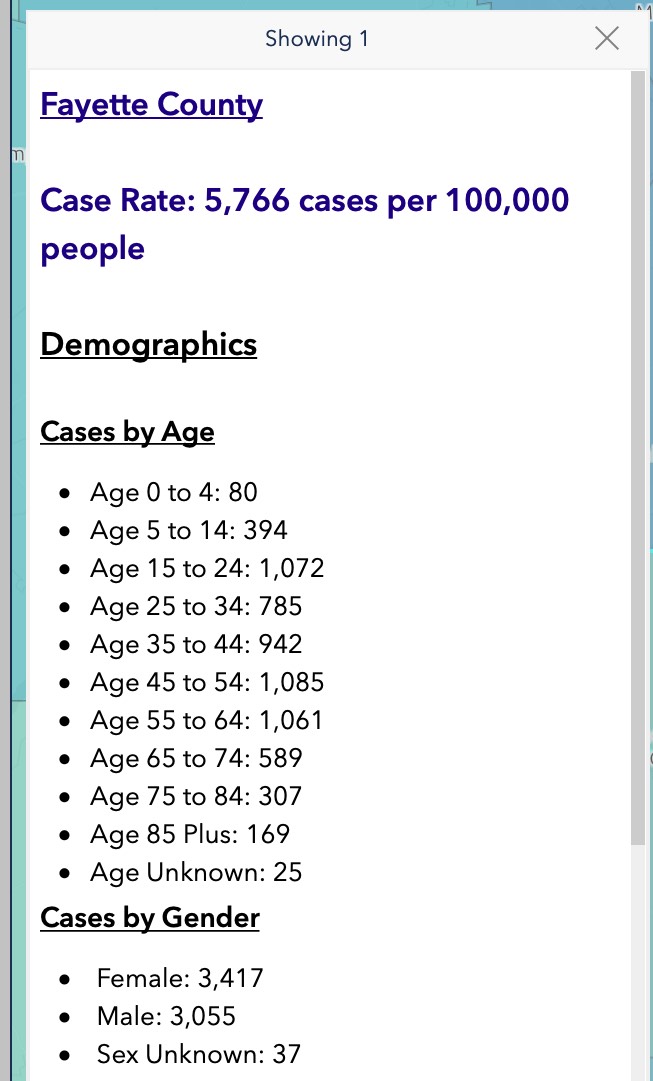
As of Thursday afternoon, DPR reported a total of 6,509 Covid cases since March 2020 and a total of 253 Fayette residents hospitalized for treatment of the infection during the 13 months of the pandemic.
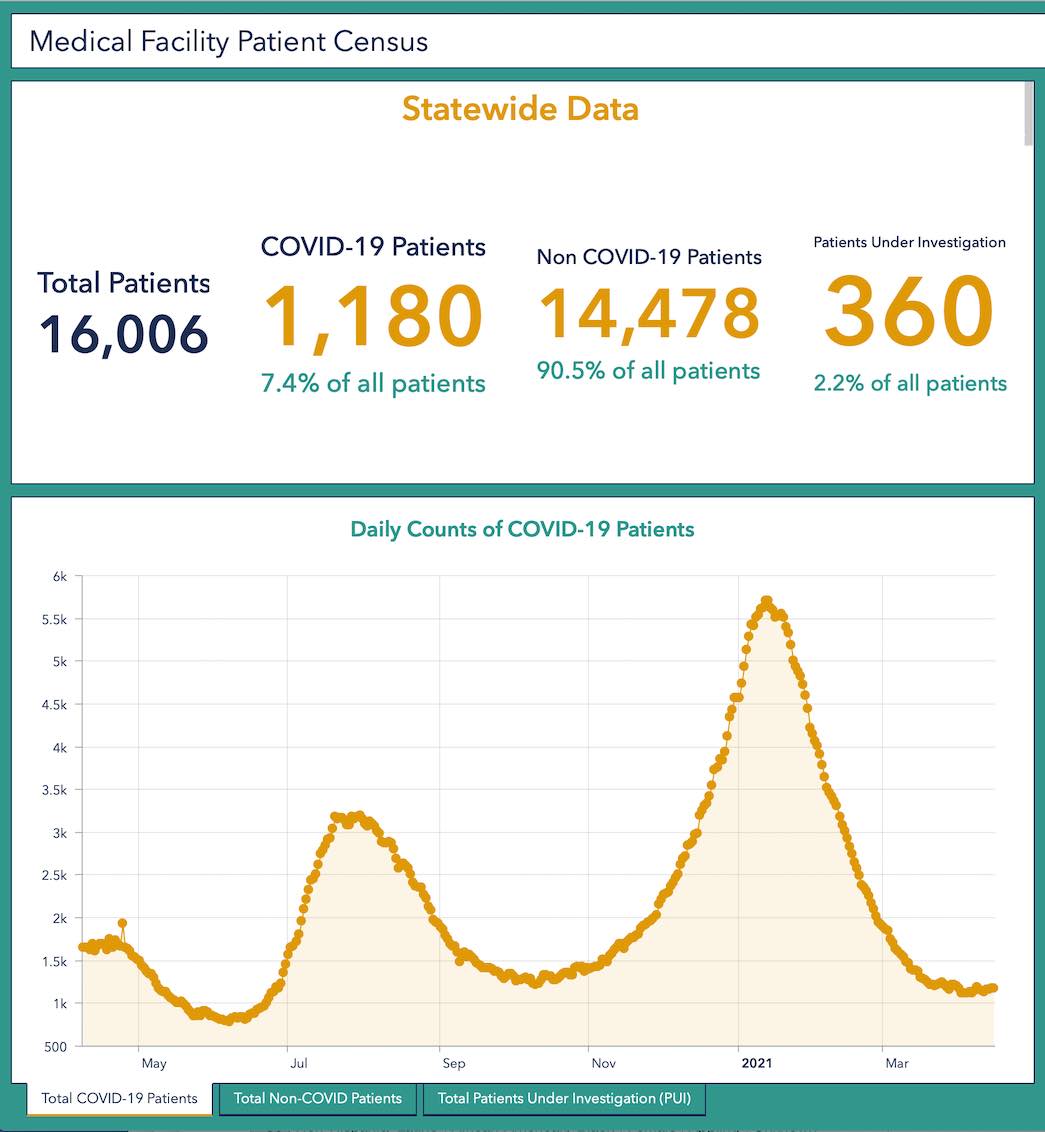
Statewide, 2-week rates had dropped to 4.7% April 11 but had ticked up to 5.2% by April 15.
State pandemic totals are 865,827 confirmed cases and 17,130 fatalities as of April 15.


Leave a Comment
You must be logged in to post a comment.