


Here’s the Covid-19 pandemic report from the Georgia Department of Public Health as of 2:50 p.m., July 18.
SUMMARY: GA total cases — CORRECTION: 139,872 (+4,689. That’s a new one-day record. The previous largest daily increase was July 10 with 4,484 new cases.)
GA deaths — 3,168 (+35); death rate of confirmed cases — 2.2%
ICU admissions — 2,819 (+38). The record single-day Covid-19 admissions number is 59, set July 15.
Hospitalizations (total) — 14,961 (+298. The daily record of new hospitalizations was 442 admissions on April 7.
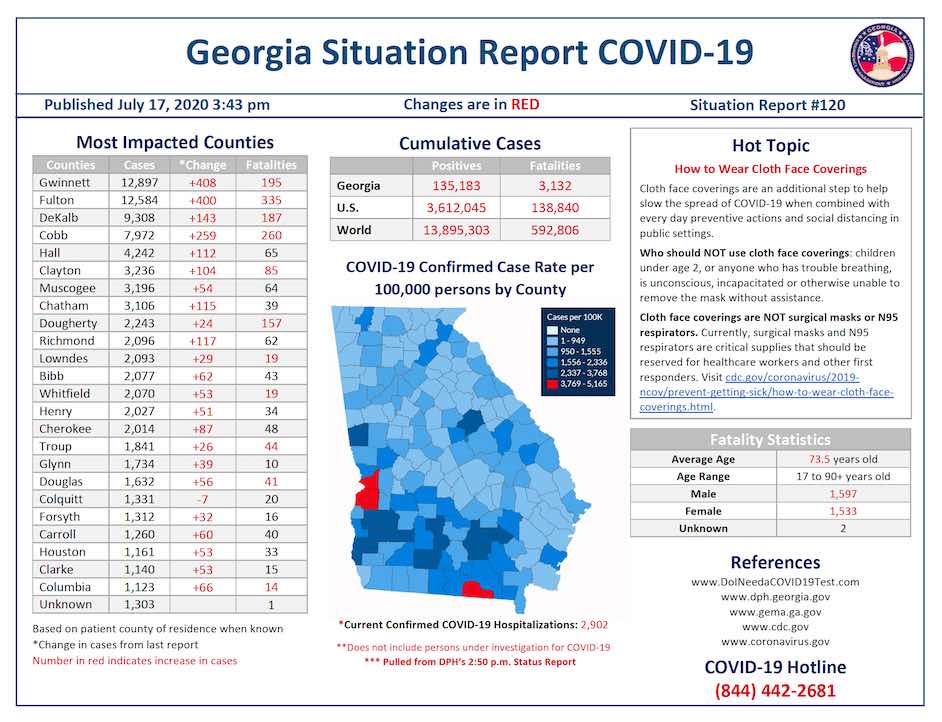
GEMA hospitalizations (July 17) — 2,902 test-confirmed Covid-19 patients currently occupying hospital beds across Georgia, 61 more than the previous day.
Total molecular tests — 1,231,806 (+33,128) (Antibody tests not included because they are not used to determine the number of confirmed cases).
Fayette cases — 629 (+17 new cases more than the previous day’s total of 612). The record for a single-day increase is 36 on July 7.
Fayette deaths — 20 (unchanged).
Fayette hospitalizations — 56 admissions, 2 more than the previous report.
Fayette death rate per 100K — 17.0
Fayette new cases since May 1 — 452; average per day increase — 5.7. New cases since July 1 — 288. Fayette’s average during July = 16 new cases a day.
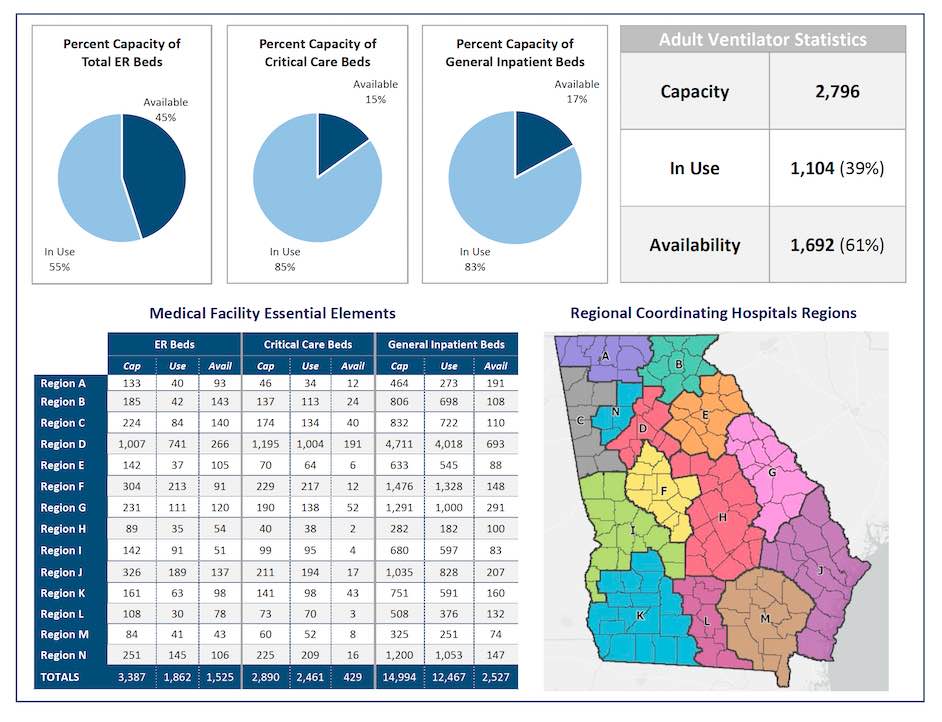
Here is the July 17 situation report from the Georgia Emergency Management Agency. The report shows that, as of July 17 across the state, 2,902 persons are currently hospitalized and being treated for Covid-19, 61 more than the previous day; that 429 critical care beds (15%) remain available for incoming patients out of a total capacity of 2,890 critical care beds; and that 39% of the state’s available adult ventilators are in use.
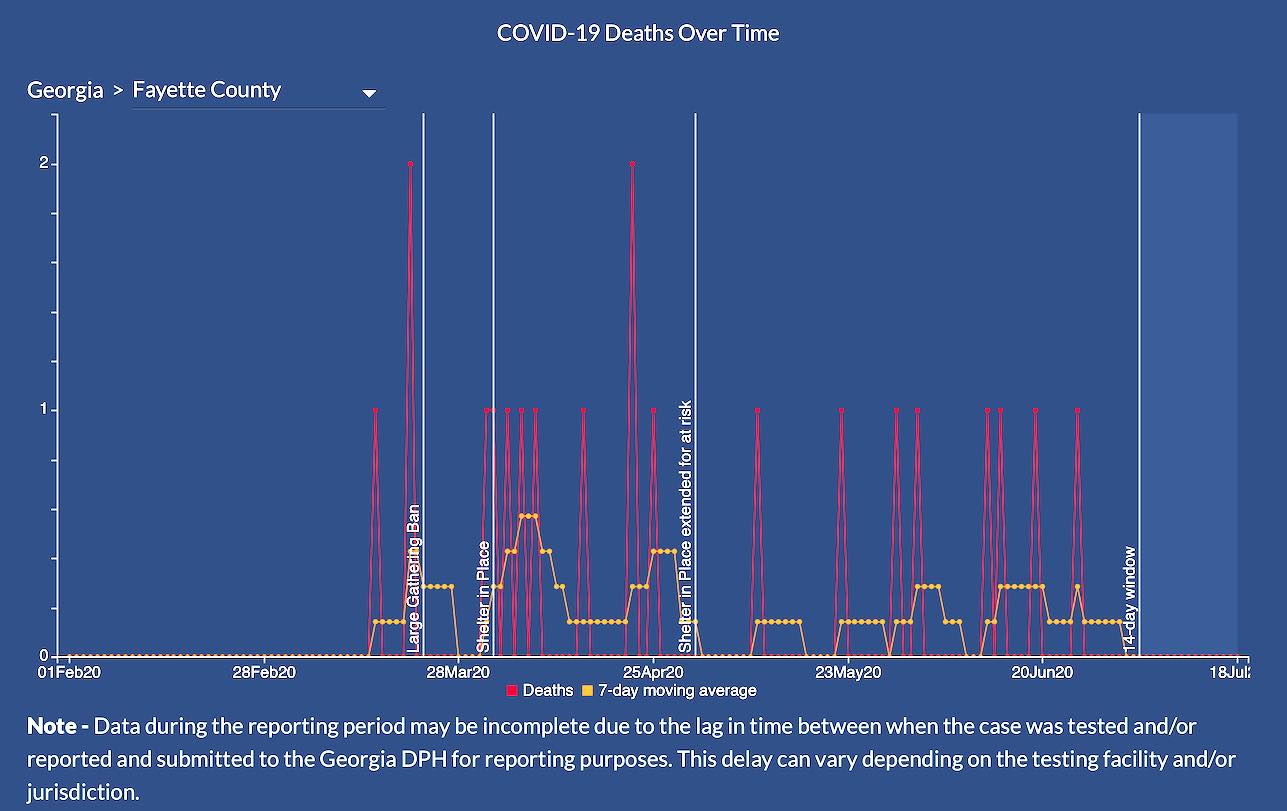
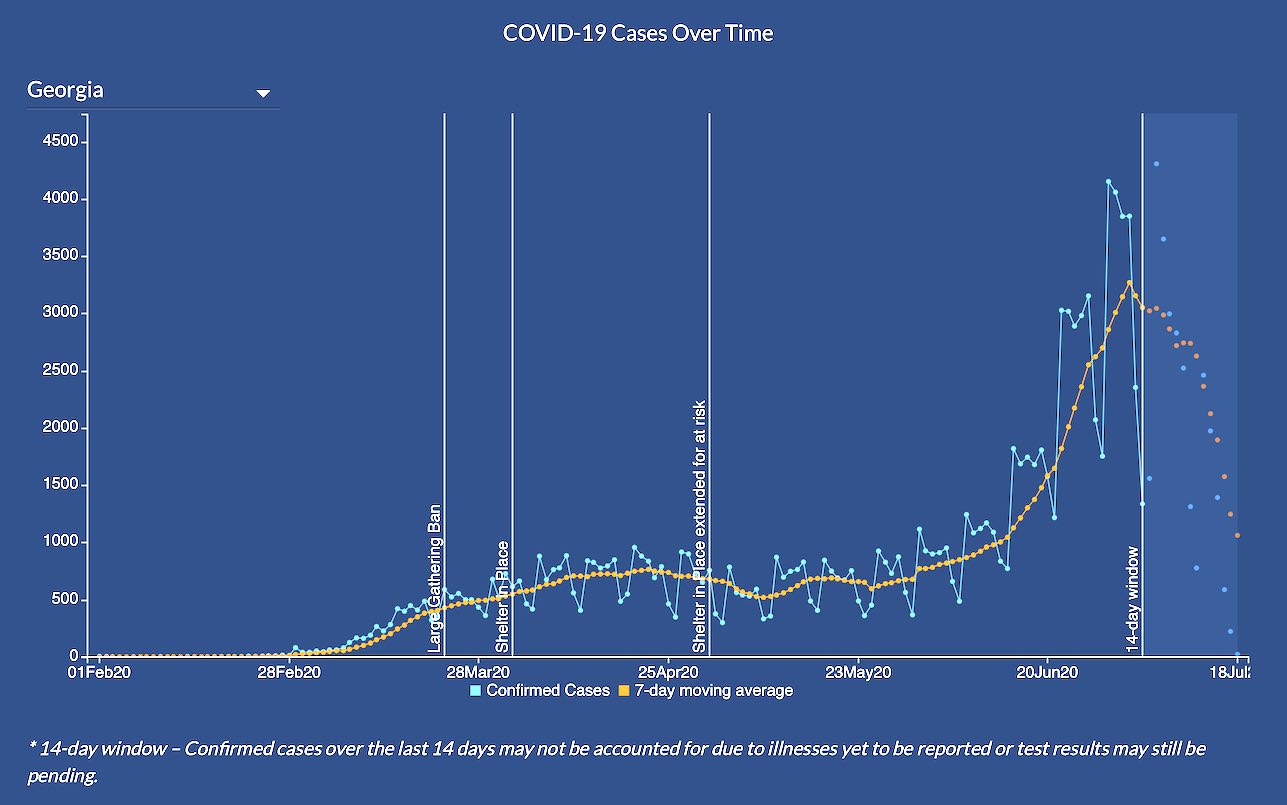
The graphs below represent a Fayette County report of cases over time in the first graph, and Fayette deaths over time just below that.
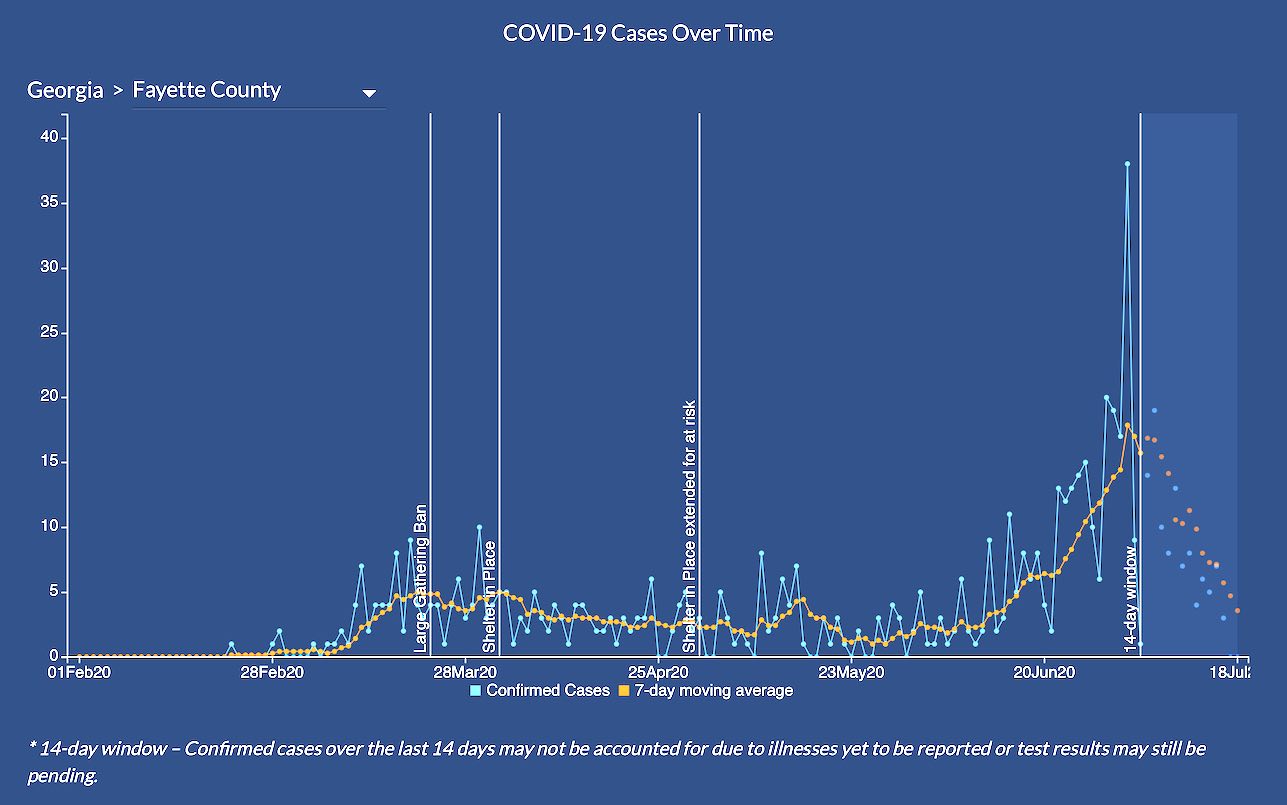
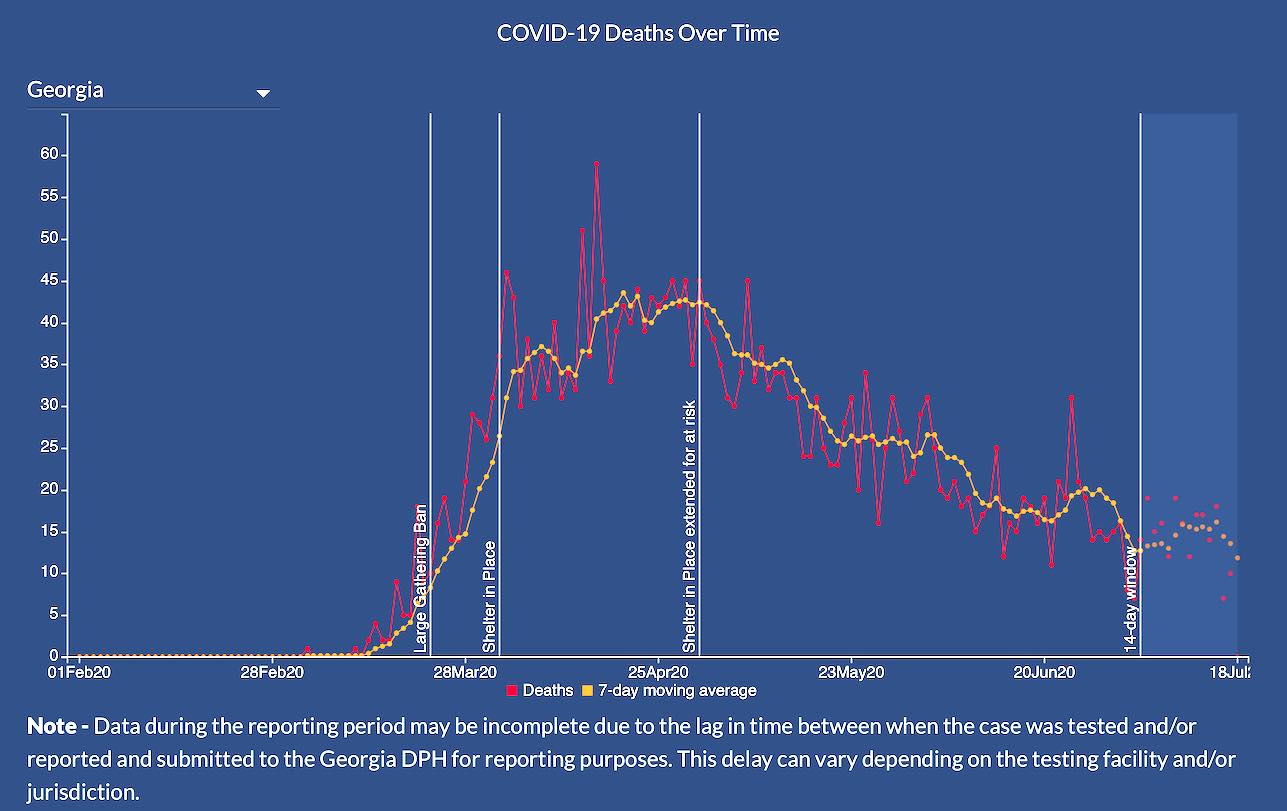
Graphs below show statewide cases over time and Covid-19 deaths over time. According to DPH, the Covid-19 cases over time “is meant to aid understanding whether the outbreak is growing, leveling off, or declining and can help to guide the Covid-19 response.”
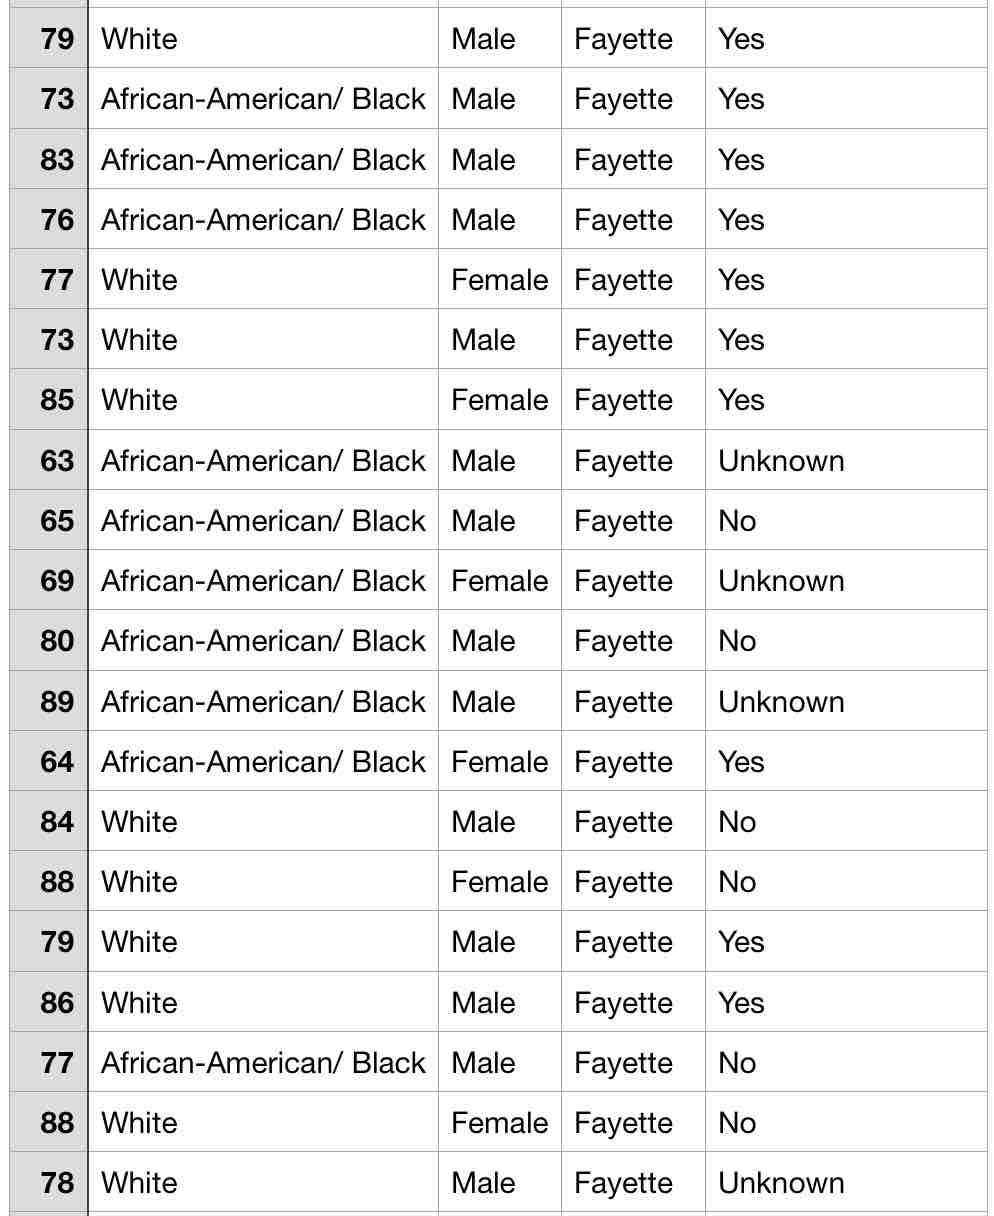
Below is a current DPH chart of reported Covid-19-related deaths that have occurred in Fayette County since the start of the pandemic. The chart is updated to reflect the latest data — 20 deaths attributed to the coronavirus. It adds a white male, age 78, with unknown underlying medical conditions. The newest chart also changed the age of a white female second from the last entry in the list from 89 to 88.
Here’s the breakdown: 8 black males, ranging from the youngest victim at 63 to the oldest male victim at 89; 6 white males, ranging from 73 to 86; 4 white females from 77 to 88; and 2 black females, ages 64 and 69.
The chart lists from left to right the age of the victim, the race, the sex, the county, and yes or no or unknown as to whether the victim had an underlying medical condition:
Total test-confirmed cases statewide: CORRECTION: 139,872 cases, which is 4,689 more cases than the previous day’s total of 135,183, an increase of 3.4%. That’s a new one-day record. The previous daily record increase for new cases was 4,484 on July 10. All of Georgia’s 159 counties have reported coronavirus cases.
Statewide deaths: 3,168, an increase of 35 deaths over the previous day’s total of 3,132.
State Covid-19 death rate: 2.2% of all confirmed cases reported, equivalent to just over 2 deaths for every 100 test-confirmed cases.
Fayette County: Confirmed infections — 629 (17 more new cases than the previous day’s 612). Total Covid-19 deaths: 20, unchanged from the previous report. Fayette’s confirmed case rate: 535.1 cases per 100,000 persons (or just over one-half of 1%). Fayette death rate per 100,000 population: 17.0. Hospitalizations: 56, 2 more than the previous report. Fayette has recorded 452 new Covid-19 cases since May 1. That’s an average of 5.7 new cases per day over the period since May 1. New cases since July 1 — 288. Fayette’s average during July = 16 new cases a day. Fayette’s record daily increase so far is July 7 with 36 new cases.
Coweta County: Confirmed infections — 988 (25 more cases than the previous day’s 963). Coweta is reporting 16 deaths, unchanged from the previous report. Coweta’s confirmed case rate: 650 cases per 100,000 persons. Coweta death rate per 100,000 population: 10.5. Hospitalizations: 71, 2 more than the previous report.
Hospitalized: 14,961 cumulative Covid-19 hospitalizations statewide from the beginning of the pandemic to today, which is 10.6% of the total cumulative confirmed cases to date, compared to 14,647 cumulative total one day earlier, an increase of 298 newly hospitalized patients across the state of Georgia. Highest admission day of the pandemic so far was 442 new admissions on April 7.
Intensive care unit admissions: 2,819 admissions, which is 38 more new ICU patients than the previous day’s cumulative report of 2,781 across reporting hospitals in Georgia. The single-day record of ICU admissions is 59, set July 15.
 Total molecular tests: 1,231,806 (33,128 more tests than the previous report).
Total positive tests: 139,872 confirmed cases so far with all molecular testing from both commercial and state labs, a positive confirmation rate of 11.3% of the total tests administered. The positive confirmation rate is now slightly more than 1 out of 10, meaning that just under 9 out of every 10 tests show no presence of coronavirus.
Covid-19 in neighboring counties
Fulton — 12,872 new cases, 339 deaths; Clayton — 3,331 cases, 85 deaths; Henry — 2,098 cases, 34 deaths; Coweta — 988 cases, 16 deaths; Spalding — 639 cases, 33 deaths; Fayette — 629 cases, 20 deaths.
Top 5 counties with most deaths: Fulton, 339; Cobb, 263; Gwinnett, 197; Dougherty, 158; DeKalb, 188.
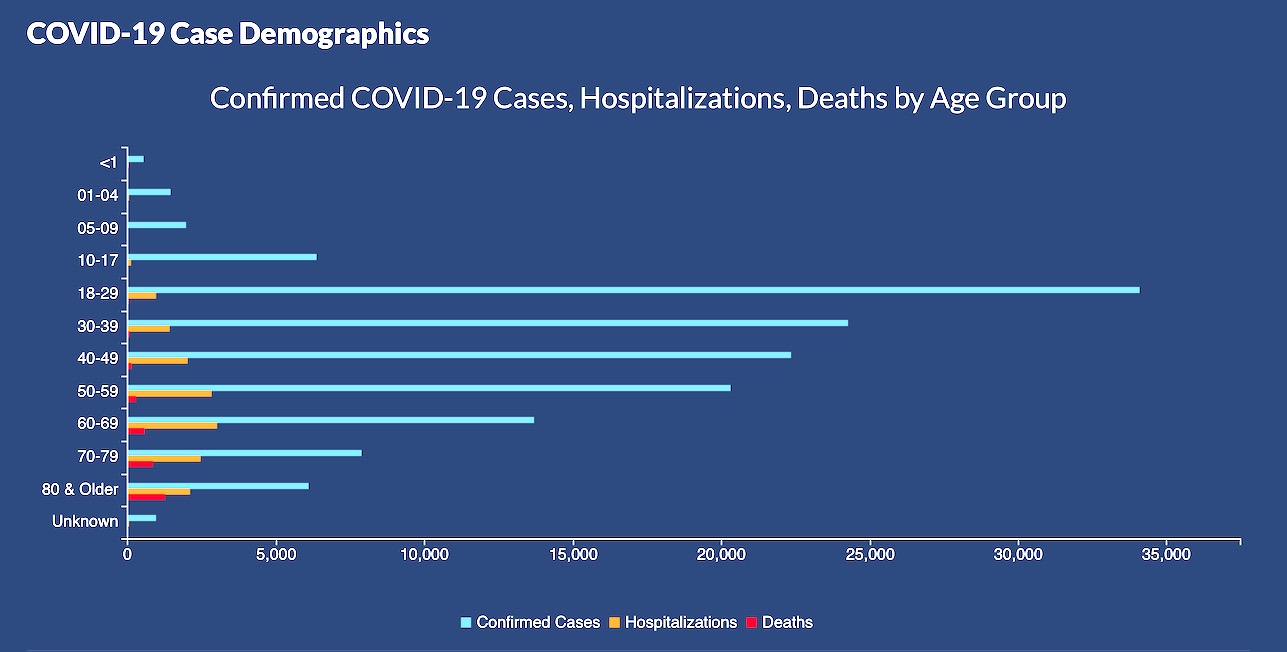
The chart below demonstrates statistics about who caught the coronavirus by age group, who was hospitalized by age group, and who died by age group.
Here’s what the raw numbers of new hospital patients across the state of Georgia and the corresponding rates of hospitalization increase day over day look like:
• March 26 — 79 new patients, 20% increase over previous 24-hour period
• March 27 — 93 new patients, 19.9% increase over previous 24-hour period
• March 28 — 51 new patients, 9% increase over previous 24-hour period
• March 29 — 49 new patients, 7.9% increase over previous 24-hour period
• March 30 — 41 new patients, 6.1% increase over previous 24-hour period
• March 31 — 111 new patients, 15.7% increase over previous 24-hour period
• April 1 — 134 new patients, 16.3% increase over previous 24-hour period
• April 2 — 104 new patients, 10.9% increase over previous 24-hour period
• April 3 — 102 new patients, 9.6% increase over previous 24-hour period
• April 4 — 81 new patients, 6.9% increase over previous 24-hour period
• April 5 — 44 new patients, 3.5% increase over previous 24-hour period
• April 6 — 48 new patients, 3.8% increase over previous 24-hour period
• April 7 — 442 new patients, 33.1% increase over previous 24-hour period
• April 8 — 206 new patients, 11.6% increase over previous 24-hour period
• April 9 — 179 new patients, 9% increase over previous 24-hour period
• April 10 — 192 new patients, 8.8% increase over previous 24-hour period
• April 11 — 128 new patients, 5.4% increase over previous 24-hour period
• April 12 — 26 new patients, 1% increase over previous 24-hour period
• April 13 — 81 new patients, 3.29% increase over previous 24-hour period
• April 14 — 183 new patients, 7% increase over previous 24-hour period
• April 15 — 153 new patients, 5.5% increase over previous 24-hour period
• April 16 — 118 new patients, 4% increase over previous day’s report
• April 17 — 284 new patients, 9.3% increase over previous day’s report
• April 18 — 96 new patients, 2.8% increase over previous 24-hour period
• April 19 — 44 new patients, 1.2% increase over previous 24-hour period.
• April 20 — 86 new patients, 2.4% increase over previous 24-hour period.
• April 21 — 229 new patients, 6.4% increase over previous 24-hour period.
• April 22 — 180 new patients, 4.7% increase over previous 24-hour period
• April 23 — 110 new patients, 2.7% increase over previous 24-hour period.
• April 24 — 152 new patients, 3.7% increase over previous 24-hour period.
• April 25 — 105 new patients, 2.4% increase over previous 24-hour period.
• April 26 — 33 new patients, 0.01% (one-tenth of 1 percent) increase over previous 24-hour period.
• April 27 — 74 new patients, 1.6% increase over previous 24-hour period.
• April 28 — 345 new patients, 7.7% increase over previous 24-hour period.
• April 29 — 170 new patients, 3.5% increase over previous 24-hour period.
• April 30 — 162 new patients, 3.2% increase over the previous 24-hour period.
• May 1 — 108 new patients, 2.1% increase over the previous 24-hour period.
• May 2 — 122 new patients, 2.3% increase over the previous 24-hour period.
• May 3 — 53 new patients, 0.9% increase over the previous 24-hour period.
• May 4 — 36 newly hospitalized patients, increase of 0.6% over the previous day.
• May 5 — 145 newly hospitalized patients, increase of 2.6% over the previous day.
• May 6 — 135 newly hospitalized patients, increase of 2.4% over the previous day.
• May 7 — 86 newly hospitalized patients, increase of 1.5% over the previous day.
• May 8 — 91 newly hospitalized patients, increase of 1.5% over the previous day.
• May 9 — 95 newly hospitalized patients, increase of 1.6% over the previous day.
• May 10 — 13 newly hospitalized patients, increase of under 1% over the previous day.
• May 11 — 21 newly hospitalized patients, increase of less than 1% over the previous day.
• May 12 — 115 newly hospitalized patients, increase of 1.9% over the previous day.
• May 13 — 98 newly hospitalized patients, increase of 1.5% over the previous day.
• May 14 — 117 newly hospitalized patients, increase of 1.8% over the previous day.
• May 15 — 93 newly hospitalized patients, increase of 1.4% over the previous day.
• May 16 — 297 newly hospitalized patients; [new metric provided by DPH] new ICU admissions are 20, statewide.
• May 17 — 55 newly hospitalized patients; new ICU admissions are 3, statewide.
• May 18 — 126 newly hospitalized patients; new ICU admissions are 8, statewide.
• May 19 — 86 newly hospitalized patients; new ICU admissions are 19, statewide.
• May 20 — 105 newly hospitalized patients; new ICU admissions are 33, statewide.
• May 21 — 128 newly hospitalized patients; new ICU admissions are 25, statewide.
• May 22 — 78 newly hospitalized patients; new ICU admissions are 16, statewide.
• May 23 — 98 newly hospitalized patients; new ICU admissions are 20, statewide.
• May 24 — 28 newly hospitalized patients; new ICU admissions are 5, statewide.
• May 25 — 36 newly hospitalized patients; new ICU admissions are 3, statewide.
• May 26 — 72 newly hospitalized patients; new ICU admissions are 17, statewide.
• May 27 — 119 newly hospitalized patients; new ICU admissions are 32, statewide.
• May 28 — 101 newly hospitalized patients; new ICU admissions are 26, statewide.
• May 29 — 85 newly hospitalized patients; new ICU admissions are 19, statewide.
• May 30 — 69 newly hospitalized patients; new ICU admissions are 10, statewide.
• May 31 — 25 newly hospitalized patients; new ICU admissions are 4, statewide.
• June 1 — 181 newly hospitalized patients; new ICU admissions are 6, statewide.
• June 2 — 207 newly hospitalized patients; new ICU admissions are 21, statewide.
• June 3 — 85 newly hospitalized patients; new ICU admissions are 20, statewide.
• June 4 — 138 newly hospitalized patients; new ICU admissions are 31, statewide.
• June 5 — 89 newly hospitalized patients; new ICU admissions are 25, statewide.
• June 6 — 16 newly hospitalized patients; new ICU admissions are 4, statewide.
• June 7 — 23 newly hospitalized patients; new ICU admissions are 8, statewide.
• June 8 — 61 newly hospitalized patients; new ICU admissions are 16, statewide.
• June 9 — 126 newly hospitalized patients; new ICU admissions are 35, statewide.
• June 10 — 102 newly hospitalized patients; new ICU admissions are 31, statewide.
• June 11 — 99 newly hospitalized patients; new ICU admissions are 15, statewide.
• June 12 — 108 newly hospitalized patients; new ICU admissions are 15, statewide.
• June 13 — 43 newly hospitalized patients; new statewide ICU admissions are 8.
• June 14 — 24 newly hospitalized patients; new statewide ICU admissions are 5.
• June 15 — 74 newly hospitalized patients; new statewide ICU admissions are 9.
• June 16 — 132 newly hospitalized patients; new statewide ICU admissions are 22.
• June 17 — 89 newly hospitalized patients; new statewide ICU admissions are 19.
• June 18 — 120 newly hospitalized patients; new statewide ICU admissions are 25.
• June 19 — 109 newly hospitalized patients; new statewide ICU admissions are 13.
• June 20 — 65 newly hospitalized patients; new statewide ICU admissions are 18.
• June 21 — 27 newly hospitalized patients; new statewide ICU admissions are 4.
• June 22 — 89 newly hospitalized patients; new statewide ICU admissions are 11.
• June 23 — 170 newly hospitalized patients; new statewide ICU admissions are 19.
• June 24 — 190 newly hospitalized patients; new statewide ICU admissions are 32.
• June 25 — 144 newly hospitalized patients; new statewide ICU admissions are 16.
• June 26 — 148 newly hospitalized patients; new statewide ICU admissions are 22.
• June 27 — 84 newly hospitalized patients; new statewide ICU admissions are 17.
• June 28 — 22 newly hospitalized patients; new statewide ICU admissions are 7.
• June 29 — 113 newly hospitalized patients; new statewide ICU admissions are 21.
• June 30 — 227 newly hospitalized patients; new statewide ICU admissions are 34.
• July 1 — 224 newly hospitalized patients; new statewide ICU admissions are 34.
• July 2 — 225 newly hospitalized patients; new statewide ICU admissions are 32.
• July 3 — 153 newly hospitalized patients; new statewide ICU admissions are 24.
• July 4 — 90 newly hospitalized patients; new statewide ICU admissions are 12.
• July 5 — 32 newly hospitalized patients; new statewide ICU admissions are 4.
• July 6 — 144 newly hospitalized patients; new statewide ICU admissions are 12.
• July 7 — 307 newly hospitalized patients; new statewide ICU admissions are 30.
• July 8 — 274 newly hospitalized patients; new statewide ICU admissions are 31.
• July 9 — 106 newly hospitalized patients; new statewide ICU admissions are 17.
• July 10 — 331 newly hospitalized patients; new statewide ICU admissions are 46.
• July 11 — 268 newly hospitalized patients; new statewide ICU admissions are 45.
• July 12 — 54 newly hospitalized patients; new statewide ICU admissions are 11.
• July 13 — 217 newly hospitalized patients; new statewide ICU admissions are 22.
• July 14 — 209 newly hospitalized patients; new statewide ICU admissions are 19.
• July 15 — 417 newly hospitalized patients; new statewide ICU admissions are 59. The ICU admissions total of 59 is a new 1-day record.
• July 16 — 244 newly hospitalized patients; new statewide ICU admissions are 34.
• July 17 — 301 newly hospitalized patients; new statewide ICU admissions are 45.
• July 18 — 298 newly hospitalized patients; new statewide ICU admissions are 38.
Below is the daily progression of cumulative reported Covid-19 cases and fatalities in Fayette County:
March 9 — 1 case, no deaths
March 13 — 5 cumulative cases, no deaths
March 17 — 5 cumulative cases, no deaths
March 19 — 9 cumulative cases, no deaths
March 20 — cumulative 9 cases, 1 death (male, 83, other medical conditions)
March 22 — 9 cumulative cases, 1 death
March 23 — 10 cumulative cases, 1 death
March 24 — 12 cumulative cases, 1 death.
March 25 — 12 cumulative cases, 1 death
March 26 — 14 cumulative cases, 2 deaths (no new details provided)
March 27 — 19 cumulative cases, 2 deaths
March 28 — 25 cumulative cases, 2 deaths
March 29 — 26 cumulative cases, 3 deaths (male, 83; male, 79; female, 77; all with underlying medical conditions)
March 30 — 32 cumulative cases, 3 deaths
March 31 — 44 cumulative cases, 4 deaths (female, 51, NO underlying medical condition)
April 1 — 48 cumulative cases, 4 deaths
April 2 — 52 cumulative cases, 4 deaths
April 3 — 58 cumulative cases, 4 deaths
April 4 — 62 cumulative cases, 4 deaths
April 5 — 67 cumulative cases, 4 deaths
April 6 — 74 cumulative cases, 4 deaths
April 7 — 79 cumulative cases, 4 deaths
April 8 — 85 cumulative cases, 4 deaths
April 9 — 89 cumulative cases, 3 deaths (one fewer than reported earlier, no explanation given by DPH, though likely a reclassification of cause of death of one person)
April 10 — 92 cumulative cases, 4 deaths (subtraction yesterday and addition today unexplained by DPH)
April 11 — 94 cumulative cases (#26 in state), 4 deaths
April 12 — 99 cumulative cases (#26 in state), 4 deaths
April 13 —105 cumulative cases (#26 in state), 5 deaths
April 14 — 112 cumulative cases, (#27 in state), 5 deaths
April 15 — 120 cumulative cases (#26 in state), 5 deaths
April 16 — 123 cumulative cases (#26 in state), 5 deaths
April 17 — 133 cumulative cases (#27 in state), 5 deaths
April 18 — 135 cumulative cases (#27 in state) with 5 deaths
April 19 — 139 cumulative cases (#27 in state) with 5 deaths
April 20— 140 cumulative cases (#27 in state) with 5 deaths
April 21 — 144 cumulative cases (#28 in state) with 8 deaths
April 22 — 145 cumulative cases (#28 in state) with 8 deaths
April 23 — 152 cumulative cases (#29 in state) with 8 deaths.
April 24 — 156 cumulative cases (#29 in state) with 8 deaths.
April 25 — 158 cumulative cases (#29 in state) with 8 deaths
April 26 — 161 cumulative cases (#31 in state) with 8 deaths
April 27 — 165 cumulative cases (#30 in state) with 8 deaths.
April 28 — 170 cumulative cases with 9 deaths; 29 hospitalizations.
April 29 — 171 cumulative cases with 9 deaths; 32 hospitalizations.
April 30 — 180 cumulative cases with 10 deaths; 33 hospitalizations.
May 1 — 177 (DPH revised number) cumulative cases with 10 deaths, 33 hospitalizations
May 2 — 180 cumulative cases with 10 deaths, 35 hospitalizations
May 3 — 182 cumulative cases with 10 deaths, 35 hospitalizations
May 4 — 188 cumulative cases with 10 deaths, 35 hospitalizations
May 5 — 185 cumulative cases (unexplained decline) with 10 deaths, 35 hospitalizations
May 6 — 194 cumulative cases with 10 deaths, 36 hospitalizations
May 7 — 188 cumulative cases (unexplained decline) with 11 deaths, 36 hospitalizations.
May 8 — 190 cumulative cases with 12 deaths, 36 hospitalizations.
May 9 — 194 cumulative cases with 12 deaths, 36 hospitalizations.
May 10 — 199 cumulative cases with 12 deaths, 36 hospitalizations.
May 11 — 200 cumulative cases with 12 deaths, 36 hospitalizations.
May 12 — 201 cumulative cases with 12 deaths, 36 hospitalizations.
May 13 — 202 cumulative cases with 12 deaths, 36 hospitalizations.
May 14 — 201 cumulative cases with 11 deaths, 35 hospitalizations (unexplained subtraction of 1 case, 1 death and 1 hospitalization from county totals).
May 15 — 205 cumulative cases with 11 deaths, 35 hospitalizations.
May 16 — 206 cumulative cases with 11 deaths, 35 hospitalizations.
May 17 — 207 cumulative cases with 11 deaths, 35 hospitalizations.
May 18 — 206 cumulative cases with 11 deaths, 35 hospitalizations.
May 19 — 211 cumulative cases with 11 deaths, 35 hospitalizations.
May 20 — 214 cumulative cases with 11 deaths, 34 hospitalizations.
May 21 — 215 cumulative cases with 11 deaths, 34 hospitalizations.
May 22 — 213 cumulative cases with 11 deaths, 34 hospitalizations.
May 23 — 217 cumulative cases with 11 deaths, 35 hospitalizations.
May 24 — 220 cumulative cases with 11 deaths, 35 hospitalizations.
May 25 — 221 cumulative cases with 11 deaths, 35 hospitalizations.
May 26 — 230 cumulative cases with 13 deaths, 36 hospitalizations.
May 27 — 235 cumulative cases with 13 deaths, 36 hospitalizations.
May 28 — 230 cumulative cases with 13 deaths, 37 hospitalizations.
May 29 — 233 cumulative cases with 13 deaths, 37 hospitalizations.
May 30 — 235 cumulative cases with 13 deaths, 37 hospitalizations.
May 31 — 235 cumulative cases with 13 deaths, 37 hospitalizations.
June 1 — 235 cumulative cases with 13 deaths, 37 hospitalizations.
June 2 — 237 cumulative cases with 13 deaths, 38 hospitalizations.
June 3 — 239 cumulative cases with 13 deaths, 39 hospitalizations.
June 4 — 241 cumulative cases with 13 deaths, 40 hospitalizations.
June 5 — 244 cumulative cases with 15 deaths, 40 hospitalizations.
June 6 — 245 cumulative cases with 15 deaths, 40 hospitalizations.
June 7 — 245 cumulative cases with 15 deaths, 40 hospitalizations.
June 8 — 247 cumulative cases with 15 deaths, 40 hospitalizations.
June 9 — 254 cumulative cases with 15 deaths, 41 hospitalizations.
June 10 — 254 cumulative cases with 14 deaths, 41 hospitalizations.
June 11 — 258 cumulative cases with 14 deaths, 40 hospitalizations.
June 12 — 259 cumulative cases with 14 deaths, 40 hospitalizations.
June 13 — 260 cumulative cases with 14 deaths, 40 hospitalizations.
June 14 — 261 cumulative cases with 14 deaths, 40 hospitalizations.
June 15 — 261 cumulative cases with 15 deaths, 40 hospitalizations.
June 16 — 270 cumulative cases with 16 deaths, 40 hospitalizations.
June 17 — 271 cumulative cases with 16 deaths, 40 hospitalizations.
June 18 — 271 cumulative cases with 16 deaths, 40 hospitalizations.
June 19 — 278 cumulative cases with 16 deaths, 41 hospitalizations.
June 20 — 279 cumulative cases with 16 deaths, 41 hospitalizations.
June 21 — 280 cumulative cases with 16 deaths, 42 hospitalizations.
June 22 — 292 cumulative cases with 16 deaths, 43 hospitalizations.
June 23 — 299 cumulative cases with 16 deaths, 44 hospitalizations.
June 24 — 305 cumulative cases with 16 deaths, 45 hospitalizations.
June 25 — 314 cumulative cases with 17 deaths, 45 hospitalizations.
June 26 — 322 cumulative cases with 17 deaths, 46 hospitalizations.
June 27 — 324 cumulative cases with 17 deaths, 46 hospitalizations.
June 28 — 326 cumulative cases with 17 deaths, 46 hospitalizations.
June 29 — 326 cumulative cases with 17 deaths, 46 hospitalizations.
June 30 — 341 cumulative cases (+15, single largest day increase of the pandemic so far) with 17 deaths, 48 hospitalizations; 106 new cases since June 1.
July 1 — 346 cumulative cases (+5) with 19 deaths, 48 hospitalizations.
July 2 — 363 cumulative cases (+17, single largest daily increase so far) with 19 deaths, 48 hospitalizations.
July 3 — 384 cumulative cases (+21, single largest daily increase so far) with 19 deaths, 48 hospitalizations.
July 4 — 408 cumulative cases (+24, new record daily increase) with 19 deaths, 48 hospitalizations.
July 5 — 414 cumulative cases (+6) with 19 deaths, 48 hospitalizations.
July 6 — 422 cumulative cases (+8) with 19 deaths, 49 hospitalizations.
July 7 — 458 cumulative cases (+36 single largest daily increase so far for Fayette) with 19 deaths, 50 hospitalizations.
July 8 — 472 cumulative cases (+14) with 19 deaths, 50 hospitalizations.
July 9 — 476 cumulative cases (+4) with 19 deaths, 50 hospitalizations.
July 10 — 498 cumulative cases (+22) with 19 deaths, 49 hospitalizations.
July 11 — 509 cumulative cases (+11) with 19 deaths, 49 hospitalizations.
July 12 — 514 cumulative cases (+5) with 19 deaths, 49 hospitalizations.
July 13 — 532 cumulative cases (+18) with 19 deaths, 49 hospitalizations.
July 14 — 549 cumulative cases (+17) with 19 deaths, 49 hospitalizations.
July 15 — 565 cumulative cases (+16) with 20 deaths, 51 hospitalizations.
July 16 — 584 cumulative cases (+19) with 20 deaths, 52 hospitalizations.
July 17 — 612 cumulative cases (+28) with 20 deaths, 54 hospitalizations.
July 18 — 629 cumulative cases (+17) with 20 deaths, 56 hospitalizations.


Leave a Comment
You must be logged in to post a comment.