ACT results say fewer than 4 in 10 students meet all 4 benchmarks
While Fayette County high school students scored much better than the state average on the 2013-14 ACT, the recently released scores show less than 40 percent of the Fayette students who took the test meet standards that indicate they could earn a B in all of the four tested subject areas when they get to college.
“Overall, I feel like we’re improving, but we need to continue to push forward,” Assessment Coordinator Kris Floyd told the Fayette County Board of Education when she presented the scores last week.
The number of students taking the ACT has increased during the last five years and performance also has increased. “Usually it’s the other way around,” she added.
More Fayette County students tend to take the SAT college entrance exam, but many are starting to add the ACT because they hope to attend school out of state or because they want an additional score to show on college applications.
SAT scores are expected near the end of September.
Floyd said 1,700 students graduated from Fayette County schools during the 2013-14 school year, and 1,081 students took the ACT. However, some of the test takers were juniors and she was not able to determine how the scores played out for juniors versus seniors.
“This is just a quick overview,” Floyd said.
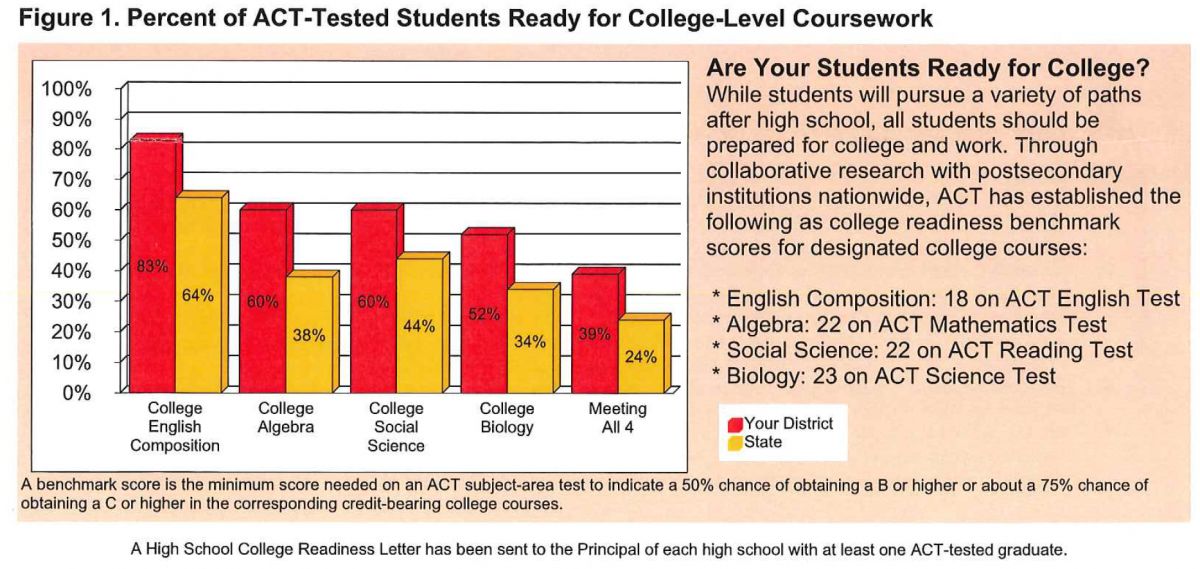
The ACT has established benchmark college readiness scores in the areas of English, algebra, social science and biology that indicate whether a student is predicted to earn a B or better in that subject when he gets to college. The information is also sorted to determine what percentage of students taking the test could meet all four benchmarks.
Fayette County students performed their best on the English composition part of the ACT and their scores indicate that 83 percent of the test takers are ready to tackle college English and earn a B or better. Only 60 percent of them are expected to earn a B or better in college algebra or social sciences, however.
And even fewer, 52 percent, are predicted to earn a B or better in a college biology class.
“College entrance exams inform the advisement process, and they afford school districts, parents and students a snapshot of a student’s college readiness profile,” said Terry Oatts, assistant superintendent of student achievement.
“The fact that Fayette County’s 2014 ACT test-taking pool consists of many underclassmen — while still exceeding the state’s and nation’s composite ACT performance even when compared to states like Colorado, Illinois, Kentucky and Tennessee who require all their juniors to take the test — speaks to Fayette County’s students’ college competitiveness and readiness,” Oatts said.
Fayette test takers earned an average composite score of 23.2, which is close to the average composite scores of students in some of the northeastern states that are known as academic powerhouses. For example, Massachusetts students earned a composite score of 24.3 and Connecticut students earned a 24. The national average composite score is 21.
A perfect score on the ACT is 36.
“The barometer for a school district’s standing would be its comparable performance to its state’s and the nation’s composite ACT performance,” Oatts said. “Fayette County Schools exceeds both the state’s and nation’s composite ACT performance.”
Neighboring Coweta County was not able to supply 2014 ACT scores before deadline, but its most recent data shows that county posting an average composite score of 20.8 in 2012. Fayette students posted an average of 22.9 that same year.
Coweta’s Northgate High School logged an average ACT composite score of 22 in 2012, but Coweta’s other schools didn’t score quite as well, which brought the average down.
The state Department of Education is expected to release individual school results for every high school in the state in about two weeks, a spokeswoman said. The state will not provide individual school district results, however.
The full ACT report is available online at https://eboard.eboardsolutions.com/meetings/TempFolder/Meetings/ACT%20Re….
Below, the full-size chart from ACT.